The Biomolecular Core Facility within the Centre for Biological Sciences seeks to provide researchers with a comprehensive platform for the preparation and characterisation of biological systems at the molecular level.
The facility supports a number of instruments throughout the Life Sciences Building, including centrifuges and sonicators for sample preparation, through to a range of biophysical methods such as mass spectrometry, fluorescence, UV/Visible spectroscopy, circular dichroism and isothermal titration calorimetry.
The Facility is run and maintained by the resident experimental officer, Neville Wright, who can provide information and training on each of the techniques offered. The charges for using the facilities are detailed in Facility Charges under CfBS: Biomolecular Core Facility - Mass Spec, Other CD Fluorescence, ITC or Multi User for routine equipment such as centrifuges, incubator shakers, gel imaging etc; this is based on heavy, medium, light and occasional use.
Absorption Spectrophotometry
Absorption spectroscopy measures the absorption of light by a sample at a particular wavelength and is widely used to measure concentrations. The level of absorption of light is related directly to the substrate concentration.
Changes in the state of a system can lead to changes in the intensity of absorption of light or to changes in the wavelength of light that is maximally absorbed making the technique useful for timecourse reactions.
The facility has a Hitachi U-3010 Spectrophotometer with 6 position sample holder and temperature control, a SLM Amino DW-2000 Dual Wavelength Spectrophotometer with sample stirrer, temperature control and is computer interfaced and a Shimadzu UV-3000 Dual Wavelength Spectrophotometer. There is also an HP Diode Array 8453 system with temperature control and advanced bioscience software control and finally a Nanodrop 2000c for rapid measurements.
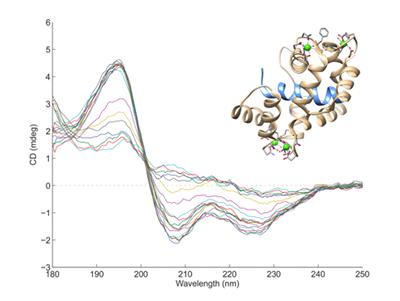
Circular Dichroism
Circular Dichroism (CD) measures the interaction of circularly polarised light with molecules that contain chiral chromophores. In proteins, the arrangement of the peptide bonds in secondary structures such as α-helices and β-sheets leads to characteristic CD spectra, allowing estimates to made of the secondary structure content of proteins. Nucleic acids also have characteristic CD spectra.
Our CD system is a Jasco J720 CD Spectrophotometer covering the spectral range 180 - 800nm. Samples should be 2.5-3.5mL in volume at a concentration of ~0.02mg/mL.
Mass Spectrometry
In electrospray ionisation (ESI) mass spectrometry a protein, DNA, or other molecule dissolved in a suitable solvent is sprayed from a fine electrically charged nozzle into a vacuum. The solvent evaporates from these droplets leaving the protein or other molecules as charged particles; their mass/charge ratio (m/z) is then determined in a mass analyser, from which the molecular mass of the particle can be determined.
We operate a VG Quattro II triple quadrupole tandem mass spectrometer equipped with ESI and APCI sources coupled to HPLC, and a Micromass LCT orthogonal acceleration time-of-flight (oaToFF) mass spectrometer equipped with nano-electrospray source.
Fluorescence Spectroscopy
Some molecules (eg tryptophan) give out light or fluoresce after they have adsorbed light. The emitted, fluorescence light, is at a longer wavelength than the adsorbed light. A fluorimeter records the intensity and wavelength dependence of the emitted fluorescence light.
We use an advanced SLM 8100 single photon counting fluorimeter and the simpler Hitachi F-2500 Fluorimeter, both under PC control. Samples should be 3-3.5mL in volume with a 1-10μM fluorophore concentration.
Isothermal Titration Calorimetry
Calorimetry measures the amount of heat absorbed or evolved during a chemical or physical change in a sample. Typically, small volumes of a ligand solution are titrated into a larger volume of a solution of protein, and the resulting heat changes are measured. Plotting the data as a function of the molar ratio of ligand to protein gives the ligand/protein binding stoichiometry and the binding constant, together with the enthalpy change for binding.
We have a Microcal ITC microcalorimeter. The instrument can perform experiments between ca 10°C and 60°C. Experimental data is analyzed using the Microcal software to convert heat changes to the required binding constants.
ITC requires relatively large amounts of protein. Per run, 2.2mL of protein sample is required, at a concentration of 10-100µM. The ligand needs to be highly water soluble, so that a 300μL stock solution of 400-600µM can be prepared per run.