Visible vs X-ray brightness flaring patterns
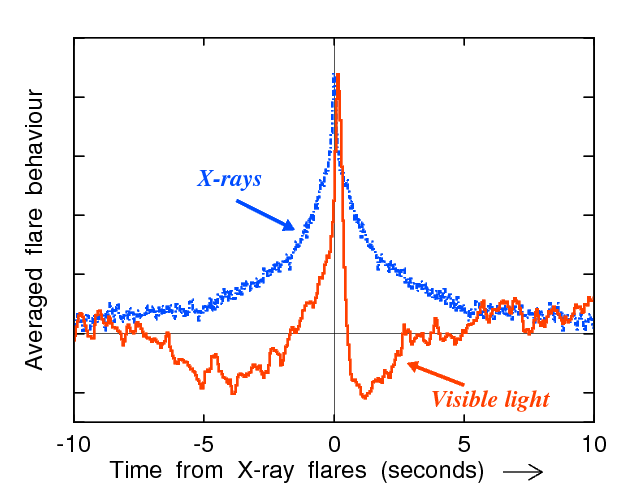
This graph shows the behaviour of GX 339-4 averaged over time-periods when the X-rays were seen to be very bright (flaring). Time progresses from left to right. The X-ray flare in blue shows a simple, broad peak, and smooth decline ranging over several seconds.
But surprisingly, the optical emission (red curve) instead decreases slightly, before displaying a fast spike just after the X-rays have peaked. The optical spike lasts just a small fraction of a second.
This sequence of events was seen repeatedly over several hours of observation. It tells us that there must be at least two physical components (a hot plasma and an outflowing particle stream, for example) that feed off the escaping black hole energy on differing timescales.
Return to Press Release page