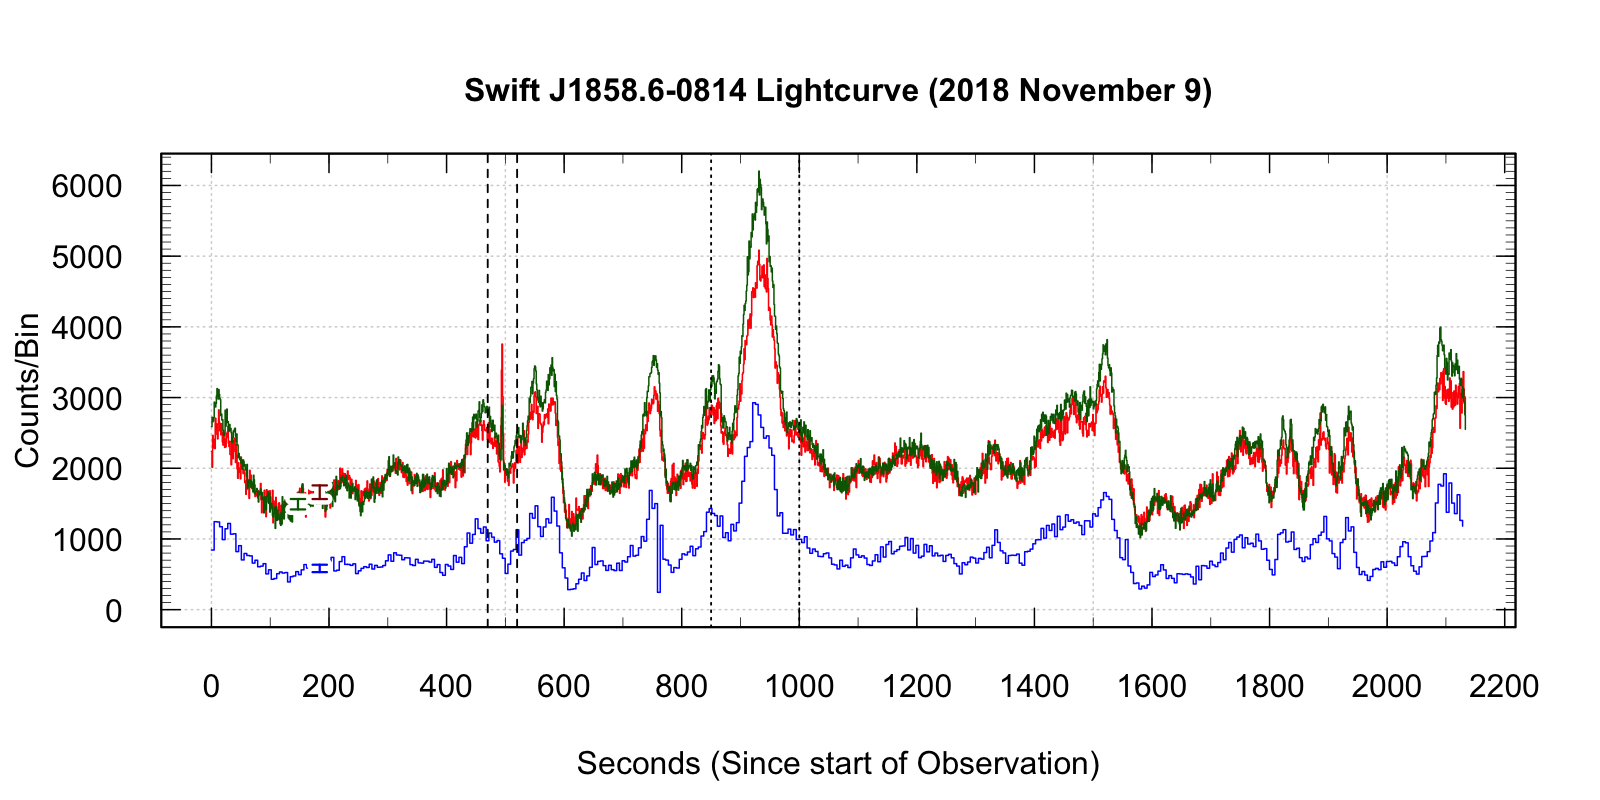
Figure 1: A segment of the simultaneous ULTRACAM lightcurves, sampled at a best cycle time of 0.92 s. Representative error bars are shown to the left. The dashed- and dotted lines demarcate the times for the zoomed-in segments in Figures 2 and 3 respectively (below).
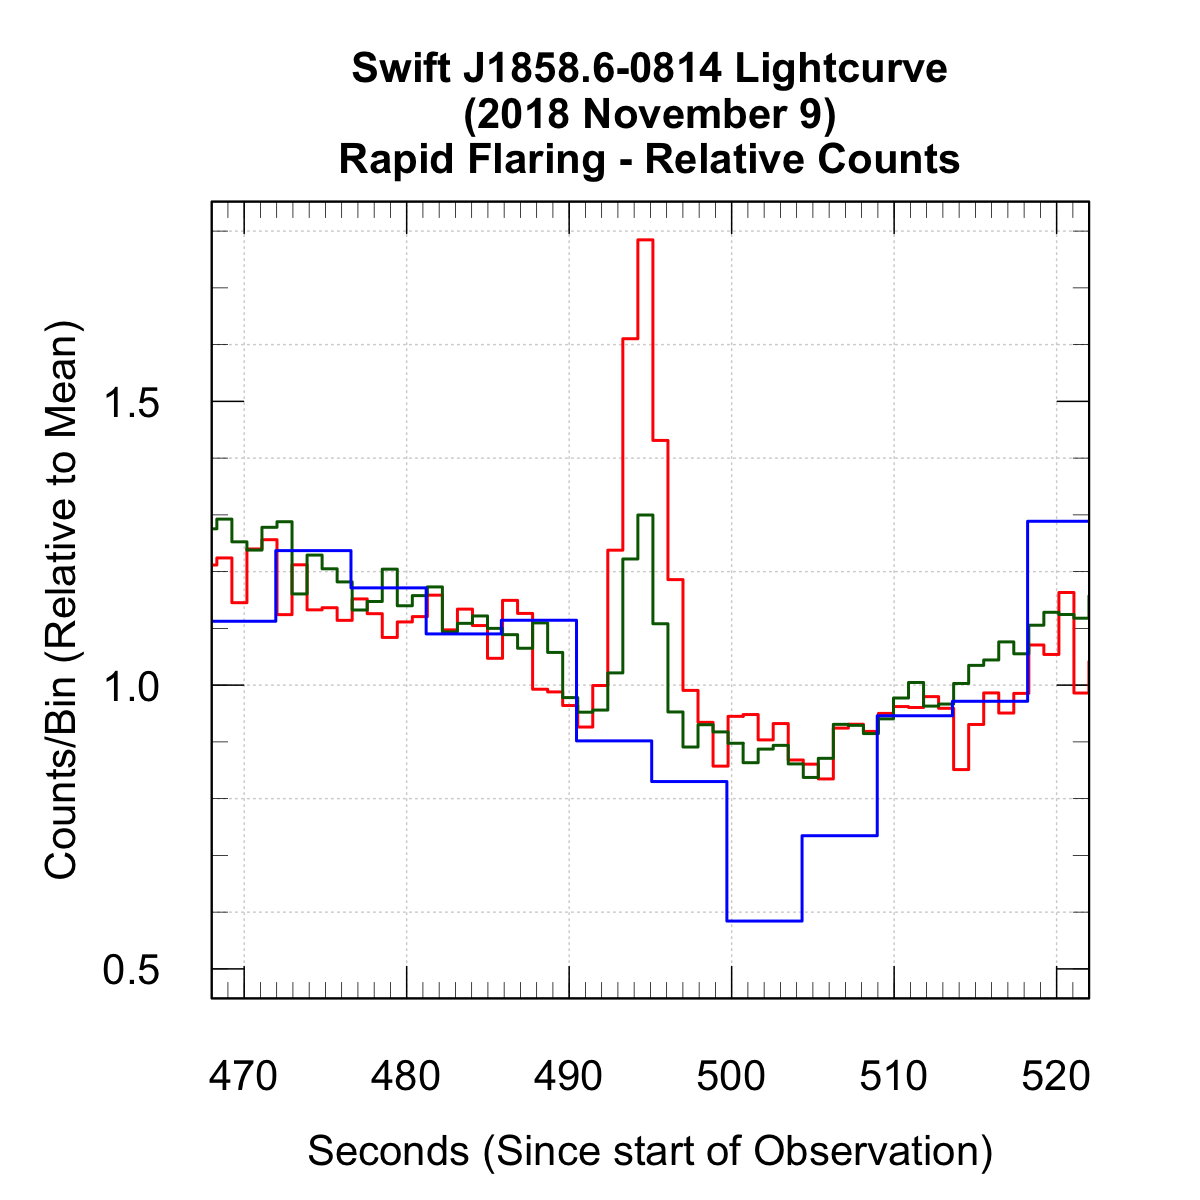
Figure 2: Zoom-in on a fast, red flare early in the observation. Lightcurves have been normalised to better show the colour.
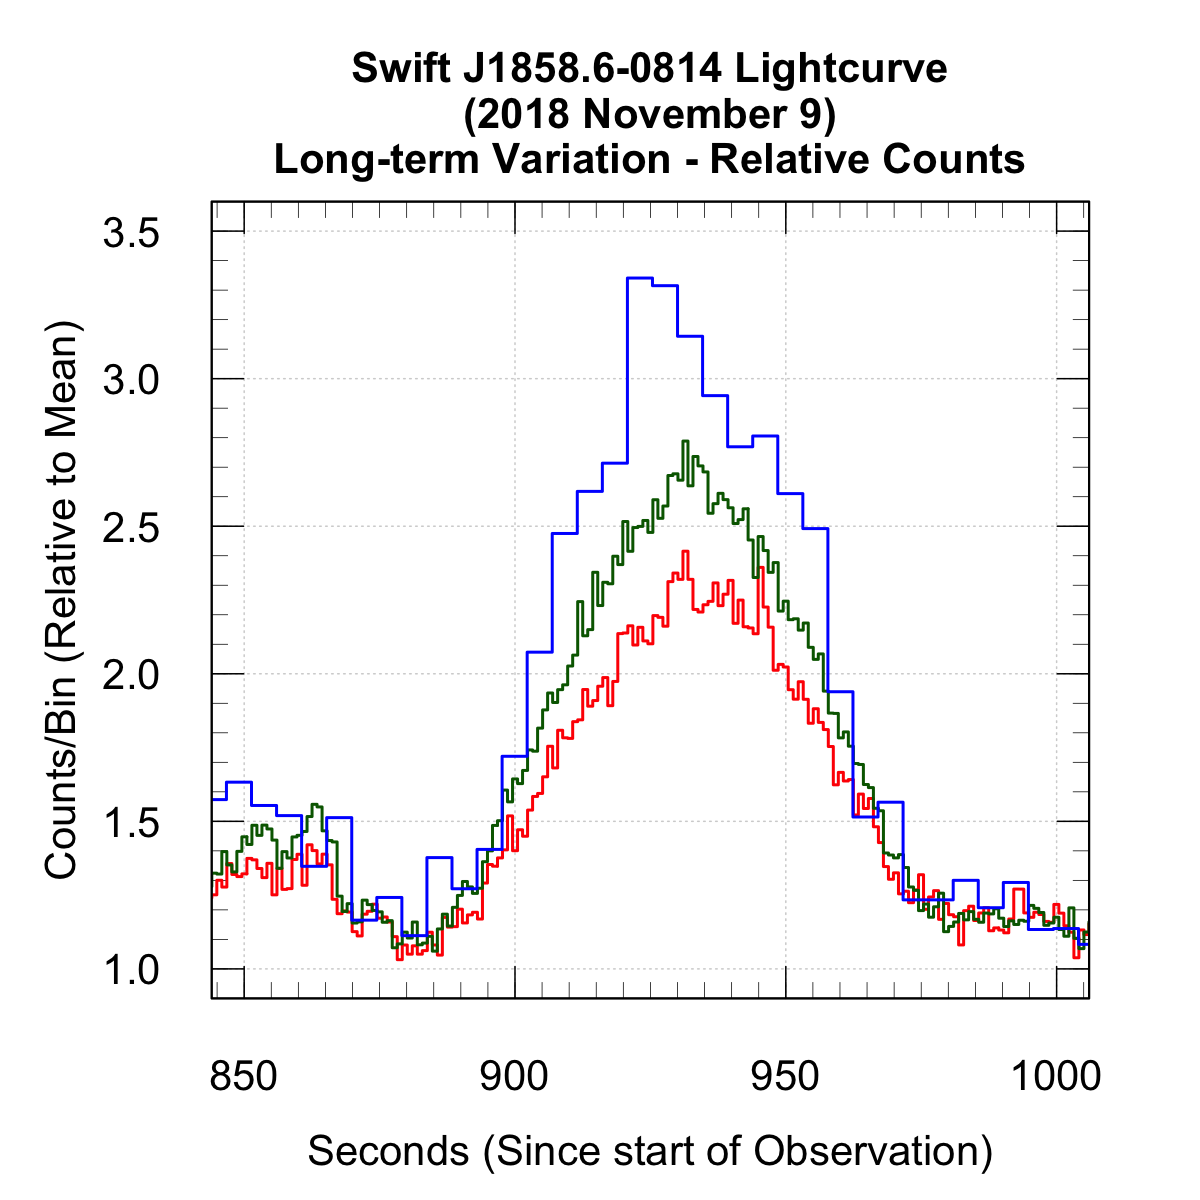
Figure 3: Zoom-in on a longer, blue flare towards the middle of the observation. Lightcurves have been normalised to highlight the colour.