Research project: Prediction of residual stress in structural glass
Currently Active:
Yes
Although recent architectural trends and the grand challenge in reducing fossil fuel dependency in the built environment have brought unprecedented opportunities, the inherent brittle fracture behaviour of glass and the lack of practical predictive tools to accommodate in routine design terms mean that glass has not been used as effectively as it might be. The objective is to demonstrate that the eigenstrain (i.e. misfit strain) technique can be used to determine the residual stress states in commercially available glass panels (Figure 1), and then by using this knowledge we will explore the efficacy of thin, transparent, self-adhesive glass fibre polymer (GFRP) sheets to prestress glass panels. The goal is to demonstrate that prestressed glass can withstand a wide range of loadings with an improved ductile and a safe post-fracture response in various structural applications such as in roofs, floors, staircases or partitions in buildings
Project Overview
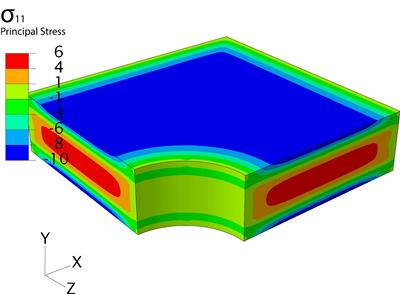
Figure 1
The misfit strains developed during the cooling of glass in the manufacturing process generate residual stresses. As it is known, the effect of residual stresses can be significant in the strength prediction of materials and thus negligence of this can lead to premature failures of the structures. Glass, in particular, is susceptible to brittle fracture failures due to the presence of inevitable surface defects.
The non-crystalline microstructure of the glass makes it impossible to determine the residual stress using conventional experimental methods such as X-ray or neutron diffraction. The current work presents a validated hybrid contour method/eigenstrain method to characterise the full field residual stresses in commercially available float and tempered glass.
The contour method was used in the present study to determine the residual stress existing in glass. The residual stress distribution determined was validated using a scatter light polariscope (SCALP-05). The main limitation of the used apparatus is that the thickness up to which it can measure the residual stress distribution is ~2.2 mm.
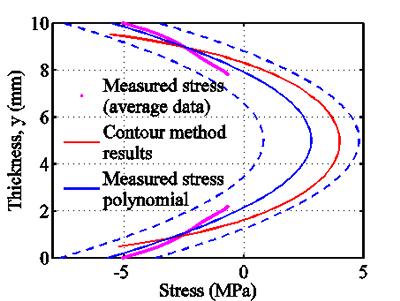
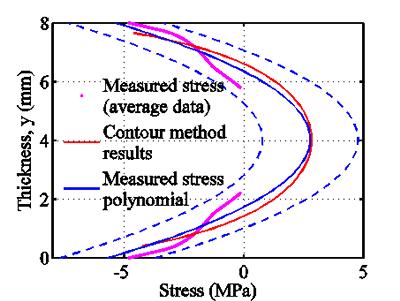
From Figure 2 and Figure 3 it can be seen that the residual stress results obtained using the contour method come in good agreement with the ones using the experimental validation.
Figure 2
Figure 3
Although the contour method provides information about the residual stresses, it is not able to advance any details about the cause of those residual stresses (i.e. eigenstrain). Using the knowledge of the constructed stress values, the eigenstrain distribution in the sample was computed from an inverse eigenstrain analysis.
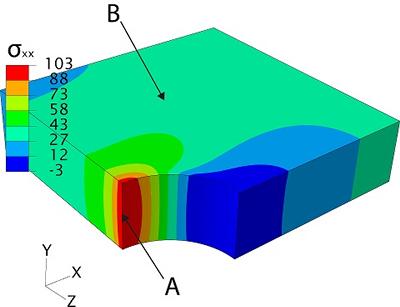
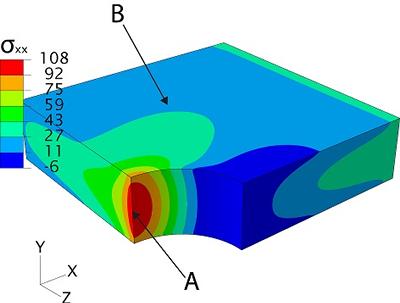
The knowledge of the eigenstrain distribution allows determining in an efficient computational manner the structural response of real-life structural glass elements of practical geometries and/or under applied loading. For instance, the knowledge of the eigenstrain profile was used to see the effects due to geometry in a practical glass element. The glass plate has a 20 mm diameter central hole and was subjected to uni-axial remote tensile stresses of 10 and 20 MPa (X direction). The results presented further are based on the FE models of the glass sample (only quarter presented due to symmetry) neglecting residual stresses (Figure 4) and respectively considering them (Figure 5) in the analysis.
The presence of the hole does not significantly affect the residual stress distribution. Under remote tensile stress, the stress distribution in the sample is no longer uniform; stress concentrations around the hole have developed as can be seen in Figure 4 and Figure 5. The results showed that, as expected, path A represents a locus where stress concentration arise, but only the FE model incorporating the initial residual stress distribution (Figure 5) is able to provide a comprehensive analysis of the stress distribution and evolution in the sample during loading.
Figure 4
Figure 5
By comparing the results (at 20 MPa remote tensile stress) it was observed that the maximum tensile stress developed around the hole (path A) in the FE model ignoring residual stresses (103 MPa) was lower than the maximum tensile stress (108 MPa) at the same location in the FE model that accounts for residual stresses. This shows that if residual stress is not considered in the analysis, the design of this structural glass element is unsafe due to the fact that in the real structure the maximum tensile stress is 108 MPa.
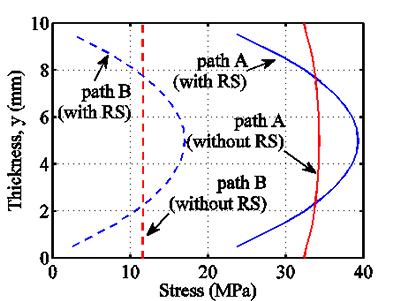
Figure 6 shows the residual stress profiles (σxx) across path A (commonly high intensity stress location) and path B (typically stress location) in both FE models, subjected to a uni-axial remote tensile stress of 10 MPa (X direction). From this figure it is evident that negligence of residual stress (RS) results in significantly different stress distribution than that is developed in the real glass specimen (i.e. when the residual stress are taken into account). It is obvious that residual stresses play an important role in the failure of a structural element. If, for example, the real glass structure modelled here was to have an ultimate tensile load of 30 MPa, the FE glass model neglecting the initial residual stress distribution (path A without RS) would result in an inadequate structural design by passing (32 MPa) the ultimate limit. Whereas, as shown in Figure 6, in the case of the FE glass model in which the residual stress distribution was considered (path A – with RS), it is clear that the ultimate limit (30 MPa) was not reached (21 MPa) and the structural element is still supporting the load.
Figure 6
The results suggest that the failure to incorporate the residual stress in the analysis may lead to prediction of different stress distribution, subsequently causing either unsafe or conservative designs.
Image descriptions
Figure 1: Residual stress distribution in a float glass sample (surface compression and mid-depth tension)
Figure 2: Residual stress distribution (σxx) along thickness in a 10 mm thick float glass sample (Dashed line - polariscope error: ±2 MPa)
Figure 3: Residual stress distribution (σxx) along thickness in a 8 mm thick float glass sample (Dashed line - polariscope error: ±2 MPa)
Figure 4: Glass sample neglecting residual stress and subjected to 20MPa (X direction) remote tensile stress
Figure 5: Glass sample incorporating residual stress and subjected to 20MPa (X direction) remote tensile stress