Understanding the Census
Using data to learn more about our communities and how we live
Southampton Spotlight shines a light on the impact our University is having across the world, through the achievements of the individuals that make up our community.
On 21 March 2021, England and Wales completed the once-in-a-decade national survey, which helps us to understand more about our communities and how we live.
We’ve all heard of the Census, but why is it so important? What does the data collected from the census get used for, and why could carrying it out in the middle of a global pandemic be both a good and bad thing?
David Martin, Professor of Geography in Geography and Environmental Science, is something of a celebrity in the Census world. His decades of involvement in the Census process and the world of population mapping has shaped the way that the survey is run. Over the years, he has worked with University colleagues and the Office of National Statistics (ONS) to develop new ways of mapping our country through its people.
Just weeks before Census 2021 took place, David spoke on our podcast, Universi-tea, to share his experiences and answer questions about the survey.
Listen to David’s podcast interview below, or find all Universi-tea episodes online.
In this Southampton Spotlight article, we’re sharing some of his answers, including some that weren’t included in the final version of the podcast episode.
Why is the Census so important, and what is it used for?
The Census in England and Wales is carried out by the ONS, the National Statistical Agency that produces data on inflation, COVID-19, population, and migration ─ so a huge range of core national information. But the Census is our one chance to attempt to count everybody and get a detailed picture.
It is important to learn how one neighbourhood differs from another: for example, in terms of deprivation, differences in COVID-19 rates, concentrations of older generations, or distributions of ethnic groups. It's not too difficult to work out roughly how many people there are in the country from quite a few different sources ─ the number of people registered with the NHS, for example. But these sources won't tell you reliably about ethnicity, how people live together in families, or about their jobs. There are many questions that the Census asks, which allow us to work out these sorts of details.
Census data gets used in a huge variety of ways. For example, we understand the differential impacts of COVID-19, because we've got the ethnicity data and the detailed geography from the 2011 census. You might find that the mix of goods down at your local supermarket will have been, in part, determined by local spending habits and basic demographics from the Census. It’s the same with predicting future school places or looking at hospital beds. We don't, at the moment, have any other source that gives that amount of detail. There's no alternative.
In a historical sense, this census will tell us a colossal amount about why we are who we are now and how we've changed over time.
Why wasn’t Census 2021 in England and Wales postponed until the pandemic had subsided?
The answer to that is, as you'd expect, a very complex one.
When we went into lockdown in March 2020 and the immediate future looked quite uncertain, England, Wales and Northern Ireland were looking at how far they were into the Census process. The questions in the Census couldn’t be changed, because they had gone through Parliament in early 2020 based on a White Paper from 2018. So, these nations all decided that they were so far through the process, and the need for the data was so pressing, that it was better to go ahead.
If you don't measure it in the moment, you can't go back, so in a historical sense this census will tell us a colossal amount about why we are who we are now and how we've changed over time.
What’s your involvement with the Census and how did this come about?
My involvement goes back to the mid-1990s. I was here at Southampton and had some study leave, and I got in touch with the ONS and asked if there was any chance of borrowing a desk and working with them for a bit.
I started looking at their first implementation of what we call a Geographic Information System (GIS). GIS is a standard technology in geography, and our undergraduates take GIS courses as part of their training. We were right at the beginning of thinking that we could use GIS in the Census. I programmed an alternative way of mapping the areas used for data, and they liked it.
I devised a prototype of the system that was used in 2001, 2011 and again now in 2021. I've carried on working on it because they're great people to work with and it's been a fascinating project. I'm only one little bit of a huge jigsaw.
What’s driven your involvement in the Census, and what are you most proud of?
Part of my motivation for getting involved in this area is my fascination with seeing small area mapping. For me, the biggest satisfaction is seeing it used in academic papers, newspapers, websites ─ people using the data that we've helped to create.
What matters to me is when people want to use the data because they want to hold the government to account and use it to work out how we will go forward from here. I get a big kick out of seeing that change is happening; it's a real opportunity to make a difference.
I get a big kick out of seeing that change is happening; it's a real opportunity to make a difference.
How will you and your colleagues at the University use the data from the Census?
Understanding the Census data is core to much work in social statistics, for example in the ESRC Centre for Population Change in Social Sciences.
Many of my colleagues are looking at whether, in the future, we could update some of the Census information more frequently through better methods, so we wouldn’t have to do something quite so big every 10 years.
Other colleagues are interested in areas such as environmental justice or even flight routes for drones. Data on population density is crucial for both these areas as it tells us how many people you might be flying over or whether or not the least advantaged groups are situated in the areas which are most prone to flooding or industrial pollution.
Related Staff Member
Professor David Martin
Professor David Martin is Professor of Geography within Geography and Environmental Science at the University of Southampton.
Read more
You may also be interested in:
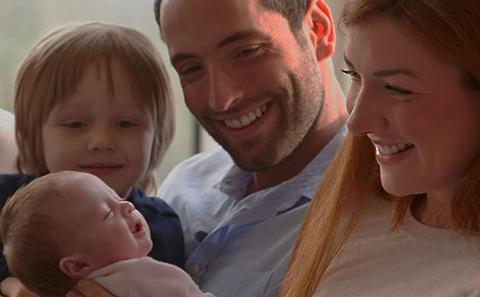
How long are we going to live?
Researchers at the University of Southampton have been at the forefront of developing innovative methods for estimating and forecasting mortality.
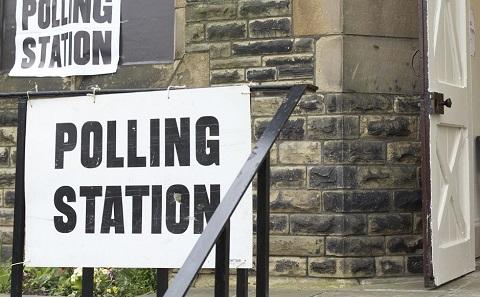
Opinion polling: still key in elections
Highlighting the importance of opinion polls worldwide
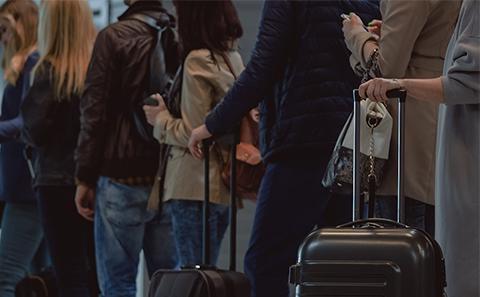
Migration and international students
Informing the debate by providing accurate migration data