Matthew Lawson1, Philipp Schneider2,3, Peter Lackie1, Jane Warner1
University of Southampton
1. Academic Unit of Clinical and Experimental Sciences, Faculty of Medicine
2. Bioengineering Research Group, Faculty of Engineering and the Environment
3. μ-VIS X-Ray Imaging Centre, Faculty of Engineering and the Environment
Background
Micro-computed tomography (µCT) is a non-destructive imaging technique that can reveal the 3D lung microstructure. 3D networks in µCT images are generally identified and segmented by manually tracing their outline, which is very time consuming and requires specialist knowledge of the tissue. We devised a new method to segment 3D networks semi-automatically and specific cell types by correlating µCT imaging with immunofluorescence microscopy.
Role of µCT
Using a prototype µCT system optimised for unstained soft tissues (Nikon Metrology, UK) we imaged unstained formalin-fixed paraffin-embedded human lung tissue at a voxel (3D pixel) size of 6-10 µm. The tissue was then sectioned and specific immunofluorescence staining performed at 20 µm intervals with primary antibodies for CK18 (airway epithelium), podoplanin (lymphatic endothelium) and CD68 (macrophages). Fluorescence microscopy images were digitised and registered to the µCT data.
The blood vessel network was semi-automatically segmented using the µCT data and a region growing tool in the free itk-SNAP software package. The autofluorescence was used to align the 2D fluorescence microscopy to the 3D µCT images using the BigWarp plugin in ImageJ. The aligned immunofluorescence images elucidated the specific location of airway epithelium in the 3D lung volume and were used to semi-automatically segment the networks and cells. Gaps in the 3D network between the immunofluorescently stained sections were filled by interpolation guided by the µCT data using itk-SNAP.
In summary, correlation of 2D immunofluorescence and 3D µCT data permits localisation and segmentation of 3D lung networks and individual cell types in fixed human lung tissue. This novel workflow provides accurate, specific, and faster 3D network segmentation.
Figures
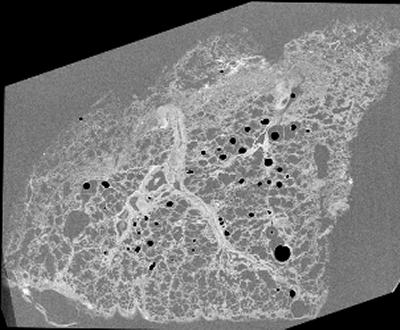
Figure 1 - Image of µCT slice of formalin fixed paraffin embedded lung tissue at 8.5 µm voxel-size
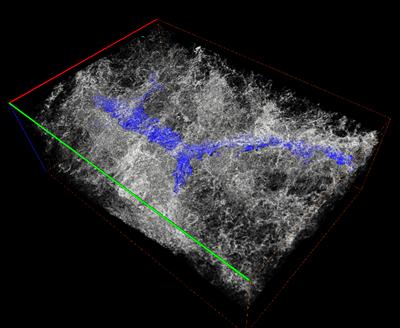
Figure 2 - Lung µCT volume containing semi-automatically segmented airway cytokeratin in blue (scale bar = 500 µm)
Acknowledgements
The authors would like to acknowledge all the staff from the Biomedical Imaging unit, the Histochemistry Research Unit and µ-VIS X-Ray Imaging Centre who assisted with this project. Funding for this project was provided by the Medical Research Council and Nikon Metrology
-