James Spray, Steven Bohaty and Paul Wilson
Department of Ocean and Earth Science, National Oceanography Centre Southampton SO14 3ZH
Background
We investigated marine drill cores obtained from Northwest Atlantic Ocean, which were deposited 30 million years ago in deep waters offshore of Newfoundland, Canada. Prior to micro-CT image analysis, visual observations of these cores revealed the presence of millimeter-scale pockets of fine sand. Two possible mechanisms for deposition of these sands have been hypothesized: (i) borrowing of bottom-current-deposited sand layers, or (ii) transport and deposition by icebergs or sea ice. The latter hypothesis is significant because it is thought that no ice caps had yet formed 30 million years ago in the Northern Hemisphere, and large accumulations of glacial ice were therefore confined to Antarctica.
Role of computed tomography
Application of micro-CT scanning techniques at the µ-VIS facility at the Univ. of Southampton was aimed at examining the three-dimensional structure of the sandy pockets within the Newfoundland core samples. These images revealed that the sand was most likely not delivered to the site by ice, but the sand pockets visible on the core surfaces were instead part of an interconnected network of sandy burrows made by benthic organisms living within the sediment. Processing of the micro-CT scans allowed the fine-scale nature of the sandy burrows to be distinguished from the surrounding muddy sediment in a non-destructive manner. The micro-CT analysis was crucial in determining the correct process responsible for the sand structures observed in the cores, which had previously been misinterpreted.
Acknowledgements
The authors would like to acknowledge funding and support for this study from NERC, UK-IODP and Halliburton Neftex. The sediment samples used in this study were provided by the International Ocean Discovery Program.
- -
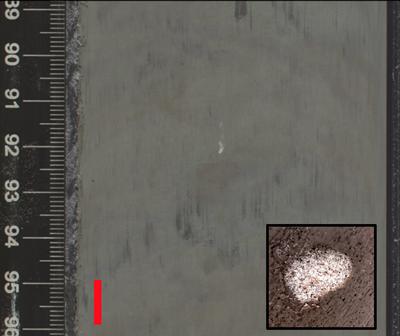
Figure 1: Split surface of a deep-sea sediment core, showing a mm-scale sandy pocket surrounded by muddy sediment. Inset shows an example of a sandy 'bleb' at higher magnification (10 x 10 mm). Scale bar= 10 mm.
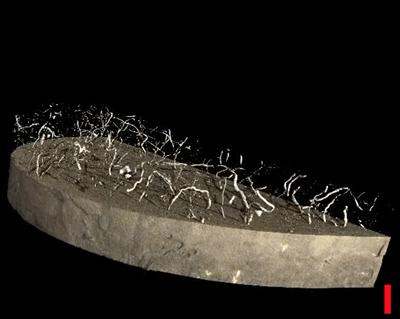
Figure 2: Processed micro-CT image of a drill core sample. Density variations between the mud and sand components allow the mud to be stripped away, revealing a complex network of sandy burrows. Scale bar = 10 mm.