Is there a statistically significant relationship between a student’s Year 11 truancy and his or her enrolment in full time education after secondary school?
A chi-square test is a statistical test used to compare observed results with expected results. The purpose of this test is to determine if a difference between observed data and expected data is due to chance, or if it is due to a relationship between the variables you are studying. Therefore, a chi-square test is an excellent choice to help us better understand and interpret the relationship between our two categorical variables.
To perform a chi-square exploring the statistical significance of the relationship between s2q10 and s1truan, select Analyze, Descriptive Statistics, and then Crosstabs.
Find s2q10 in the variable list on the left, and move it to the Row(s) box. Find s1truan in the variable list on the left, and move it to the Column(s) box.
Click Statistics, and select Chi-square.
Click Continue and then OK to run the analysis. Your output should look like the table on the right.
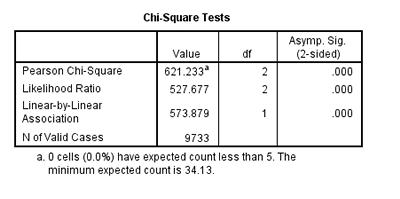
Take a look at the column on the far right of this output table. It is the Asymptotic Significance, or p-value, of the chi-square we’ve just run in SPSS. This value determines the statistical significance of the relationship we’ve just tested. In all tests of significance, if p < 0.05, we can say that there is a statistically significant relationship between the two variables. The p-value in our chi-square output is p = 0.000. This means that the relationship between Year 11 truancy and enrolment in full time education after secondary school is significant.
It’s worth mentioning now that this test, like all tests of significance, only illuminates that there is a relationship and that that relationship has statistical significance (meaning, it is not due to chance). Running a chi-square test cannot tell you anything about a causal relationship between truancy and later educational enrolment.
Let’s run one more chi square test together. Thinking about other individual characteristics that may influence a young person’s enrolment in full time education after secondary school, we may be interested in the impact parental educational attainment has on a student’s future plans. Therefore, let’s use s1q62a, which concerns whether or not a young person’s father obtained a degree, in another chi square test with s2q10.
Before we use s1q62a, we should check its frequencies to make sure the data is ready for bivariate analysis.
Go to Analyze, Descriptive Statistics, and then Frequencies. Move s1q62a into the Variable(s) box on the right side of the dialogue box.
Click OK to run a frequency test.
Notice in the frequency output table that along with the answers “Yes,” “No,” and “Not sure,” which we are interested in, there is the category “Not answered.” Because these survey respondents haven’t responded to this question, their answers are missing. We should code this information as missing data before we run our chi square test, so that we are only performing the test on data relevant to our research question.
Luckily, doing this is very easy.
First, find s1q62a in the Variable View window of the SPSS Data Editor. (You can do this easily by clicking to highlight any cell in the Name column on the far left of the Variable View screen, and hitting Ctrl + F. This will open up a Find and Replace dialogue box. Just enter s1q62a into the text bar and click Find Next. This will find the s1q62a row in the dataset.)
When you’ve found s1q62a, move across its row until you find the Values column. Click this cell to open it. Now you should see a dialogue box that lists all the numerical values of the categories of this variable.
In this dialogue box, you can see that “Not answered,” the missing data category, is listed as -9.00. In addition, there are categories “Item not applicable” (with a value of 4.00) and “Not answered (9)” (with a value of 5.00) listed. We‘ll include these in our recoding, as they also represent missing data.
To recode these categories as missing data, all you need to do is move over one column to the Missing column. The Missing column in the s1q62a row should say “None,” as no data is classed as missing just yet.
Click to open that cell. In the dialogue box that opens, select Discrete missing values and enter -9.00, 4.00, and 5.00 into the three text boxes provided. These are the numerical codes for the three categories that include missing data.
Click OK.
You should now see that our three missing codes are saved in the Missing cell of the s1q62a row. To make sure that the missing data is no longer included in tests we run using this variable, run a frequency check on s1q62a.
In this new frequency table, the “Not answered” category is listed as Missing, so our recoding has been successful.
And, because we have cleaned up s1q62a, we are ready to run our chi square test.
Select Analyze, Descriptive Statistics, and then Crosstabs. Find s2q10 in the variable list on the left, and move it to the Row(s) box. Find s1q62a in the variable list on the left, and move it to the Column(s) box.
Click Statistics, and select Chi-square. Click Continue and then OK to run the analysis. Your output should look like the table on the left.
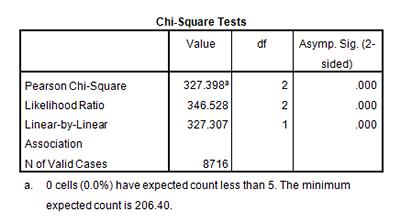
Take a look at the Asymptotic Significance of this chi square test. Using this information, what can we say about the relationship between paternal degree and full time enrolment in education after secondary school?
Run another chi square to test the significance of the relationship between s1q10 and s1q62b, a variable that concerns whether or not a survey respondent’s mother has obtained a degree. Before you run the chi square, make sure to check the frequencies in s1q62b and make any corrections you think are necessary.
Is there a statistically significant relationship between maternal degree and full time education after secondary school?
Summary
Using a chi square test, you’ve just determined that there is, in fact, a statistically significant relationship between our two categorical variables, s2q10 and s1truan. In addition, you’ve run another chi square, determining that there is a statistically significant relationship between s2q10 and s1q62a, a measure of whether or not a respondent’s father had obtained a degree. Remember that you are simply able to say now that paternal degree and Year 11 truancy both have relationships with respondent enrolment in full time education after secondary school. You cannot say, for example, that a paternal degree causes enrolment in full time education.
Note: as we are making changes to a dataset we’ll continue using for the rest of this section, please make sure to save your changes before you close down SPSS. This will save you having to repeat sections you’ve already completed.