Is there a relationship between a student’s Year 11 truancy and his or her enrolment in full time education after secondary school?
Let’s say you want to examine the relationship between two categorical variables, such as gender and income level, or location and home ownership. You can use cross tabulation (and eventually a chi-squared test) to determine whether there is a significant relationship between the two categorical variables you are interested in.
Cross tabulation allows you to summarize the data in categorical variables and examine it to determine if there are any relationships present. SPSS provides cross tabulation charts that show you how many individuals (or cases) are present in each group. For example, if you ran a cross tabulation on gender and income bracket, with gender having two categories (female and male) and income level having five categories (very high, high, average, low, and very low), you would be able to see, for example, how women have high incomes and how many men have average incomes.
For our cross tabulations, we should consider variables that reflect our research question, which is, “Is there a relationship between a student’s history of truancy in Year 11 and his or her enrolment in full time education after secondary school?” We can continue to use s2q10, as it concerns the education enrolment status of each student. Because we’re interested in illuminating the relationship between enrolment in full time education and previous truancy, the second categorical variable we’ll use is s1truan, which details the truancy behaviours of students in Year 11.
As we’ve already run frequency tests on s2q10, we can be sure that the data is clean and ready for analysis. We can run a quick frequency test on s1truan to make sure we can use it in our cross tabulation. Using the method outlined here, check the data in s1truan and recode any unanswered or missing data.
Now that we've cleaned up our variables, we can run some cross tabulations, asking SPSS to calculate the counts and percentage totals for respondents who fall into each group.
Select Analyze, Descriptive Statistics, and then Crosstabs.
Find s2q10 in the variable list on the left, and move it to the Row(s) box. Find s1truan in the variable list on the left, and move it to the Column(s) box.
Click on the Cells button, and then select Column under the Percentages header. While you’re here, select both Observed and Expected under the Counts header. (You’ll see why we’ve done this in a moment.)
Click Continue, and then click OK in the original dialogue box. Your output should look like the tables on the right.
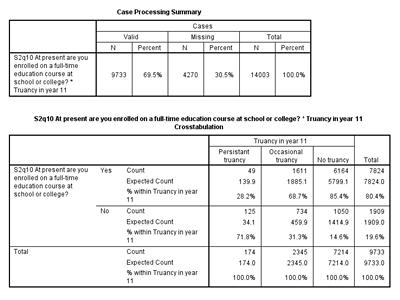
You can see in the output table above that SPSS has displayed for us the total counts and percentages for each cell. Looking at the “Yes” row at the top of table, which includes all those survey participants who were enrolled in full time education, we can see that 49 respondents who were enrolled in full time education after secondary school were persistently truant in Year 11.
What percentage of respondents who were occasionally truant in Year 11 were not enrolled in full time education after secondary school?
How many respondents who were never truant in Year 11 were enrolled in a full time education course after secondary school?
Now, why have we calculated both the actual observed counts and the expected counts for each cell? The difference between the observed count and the expected count for each cell lets us know that there is some relationship between the two variables. Expected values are what we would expect if there was no association between full time educational enrolment and Year 11 truancy. If there is a difference between observed counts and expected counts, then there may be an association between the two variables in question. However, we don’t yet know if this difference is statistically significant. We can determine if there is a statistically significant relationship between these two categorical variables by running a chi-squared test. A chi square test will determine whether the difference between the observed counts and the expected counts is big enough to say that there is an association in the population.
Summary
You’ve just run a crosstabulation comparing s2q10, our categorical dependent variable, with s1truan, a categorical variable we’ve chosen as an independent variable in our analyses. This crosstabulation showed you that there were differences between the observed counts and the expected counts. Can you say anything about the relationship between these variables yet? What do you need to do next?