Hidden drink-driving in Britain
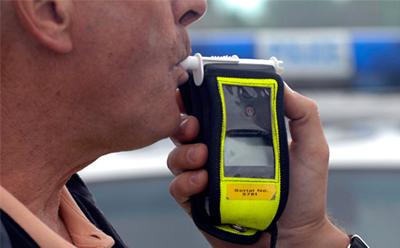
In a recent paper in the Annals of Applied Statistics, Dankmar Boehning and Peter van der Heijden address the question of hidden drink-driving in Britain. The analysis is based on police data on drivers caught several times [include picture here]. Based on the distribution of drivers caught once, twice, thrice, … it is possible to estimate the frequency of those drink-drivers who were never caught by the police. The major result is that only 10% of drink-driving is observed.
Abstract
For zero-truncated count data, as they typically arise in capture-recapture modelling, we consider modelling under one-inflation. This is motivated by police data on drink-driving in Britain which shows high one-inflation. The data, which are used here, are from the years 2011 to 2015 and are based on DR10 endorsements. We show that inference for an arbitrary count density with one-inflation can be equivalently based upon the associated zero-one truncated count density. This simplifies inference considerably including maximum likelihood estimation and likelihood ratio testing. For the drink-driving application, we use the geometric distribution which shows a good fit. We estimate the total drink-driving as about 2,300,0002,300,000 drink-drivers in the observational period. As 227,578227,578 were observed, this means that only about 10% of the drink-driving population is observed with a bootstrap confidence interval of 9%–12%.