Rapid data analysis at sea leads to largest 3D color reconstruction of the seafloor
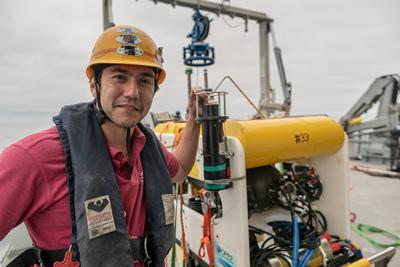
A recent expedition led by SMMI Associate Professor, Dr Blair Thornton, demonstrated how the use of autonomous robotics and artificial intelligence at sea can dramatically accelerate the exploration and study of hard to reach deep sea ecosystems, like intermittently active methane seeps.
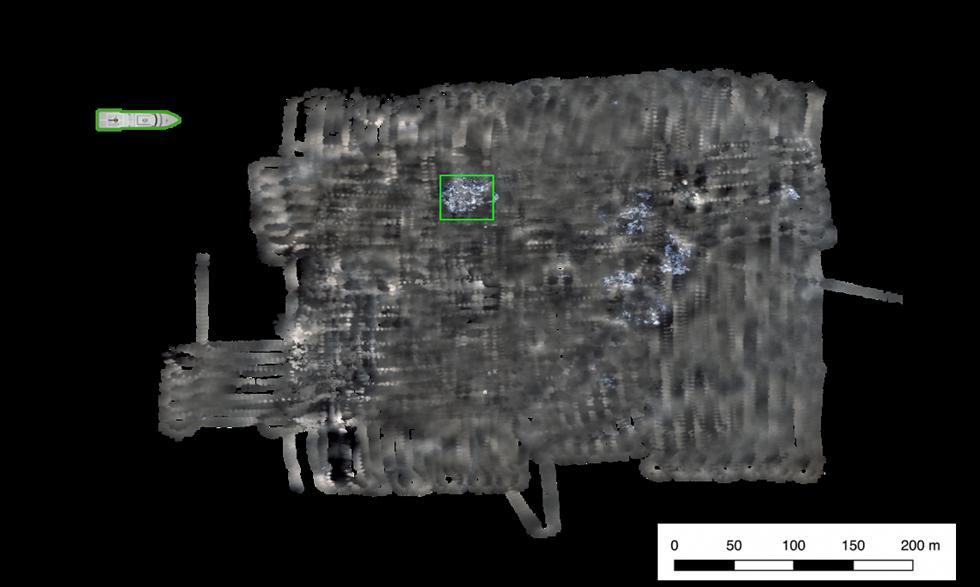
Thanks to rapid high throughput data analysis at sea, a multinational team aboard the Schmidt Ocean Institute's research vessel Falkor created a photogrammetric map of one of the best studied gas hydrate deposits - the Hydrate Ridge Region off the coast of Oregon. The resulting 3D color reconstruction of the seafloor is believed to be the largest by area, in the world, measuring more than 118,000 square meters or 11.8 hectares, and covering a region of approximately 500 x 350 meters.
This project demonstrated how modern data science can greatly increase the efficiency of conventional research at sea, and improve the productivity of interactive seafloor exploration with the all too familiar “stumbling in the dark” mode.
“Developing totally new operational workflows is risky, however, it is very relevant for applications such as seafloor monitoring, ecosystem survey and planning the installation and decommissioning of seafloor infrastructure,” said Dr Thornton, who is also Associate Professor at the Institute of Industrial Science, the University of Tokyo.
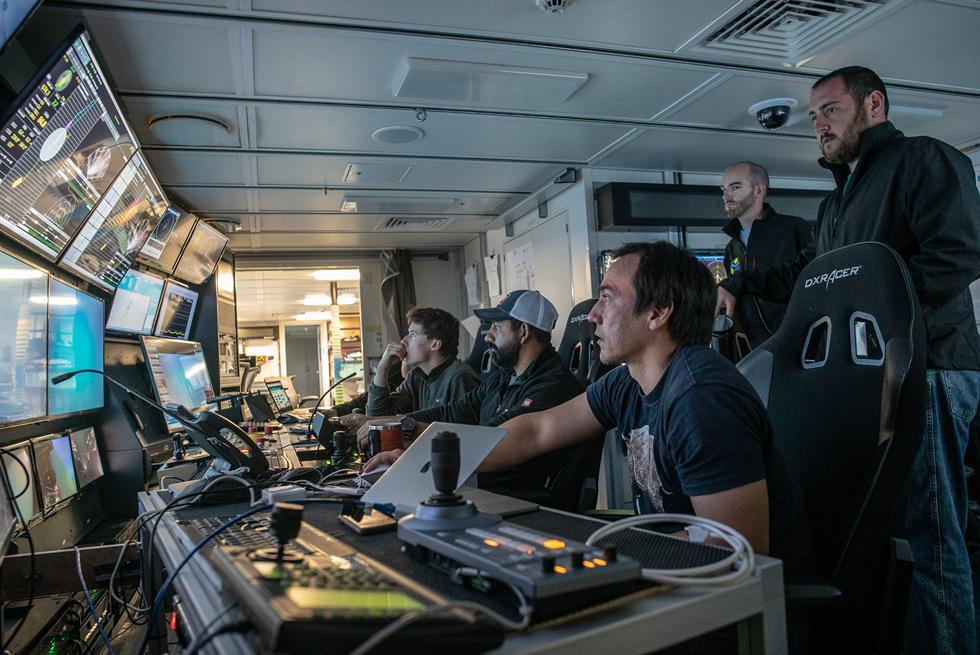
The idea behind this Adaptive Robotics mission was not to upturn the structure of how things are done at sea, but simply to remove bottlenecks in the flow of information and data-processing using computational methods and Artificial Intelligence. The algorithms used are able to rapidly produce simple summaries of observations, and form subsequent deployment plans. This way, scientists can respond to dynamic changes in the environment and target areas that will lead to the biggest operational, scientific, or environmental management gains.
More than 1.3 million seafloor images were collected and algorithmically analysed to find biological hotspots and precisely target them for interactive sampling and observations. The initial wide-area seafloor imagery was acquired with an underwater vehicle “Ae2000f” using high-altitude 3D visual mapping cameras at underwater sites between 680 and 780 meters depth.
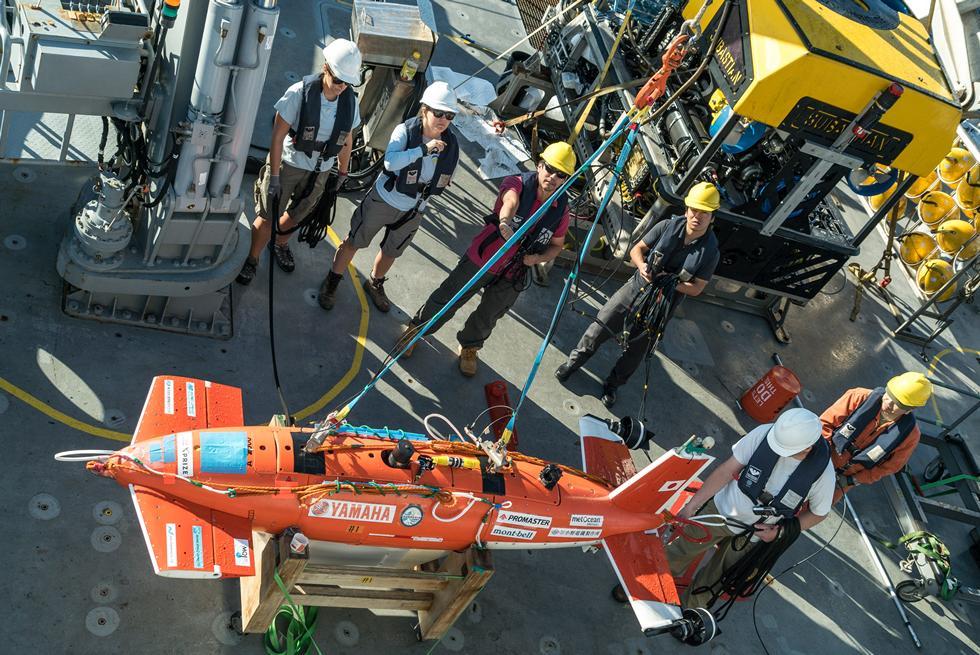
The international team deployed multiple Autonomous Underwater Vehicles (AUVs), developed by the University of Tokyo, which were equipped with 3D visual mapping technology developed jointly by the University of Sydney, University of Southampton, and the University of Tokyo and the Kyushu Institute of Technology as part of an international collaboration.
The conversion of the initial wide area survey imagery into three dimensional seafloor maps and habitat type summaries onboard Falkor, allowed the researchers to plan the subsequent robotic deployments to perform higher resolution visual imaging, environmental and chemical surveying, and physical sampling in areas of greatest interest. Nineteen AUV deployments and fifteen ROV dives were completed in total during the expedition, including several multi-vehicle operations.
Normally, maps like this would take several months to process and only after the completion of an expedition, at which point the science team is no longer at the site, and the habitats may have already evolved or expired. Instead, the research team was able to compose the 3D maps on board of Falkor within days of the images being acquired. The composite map was used during the expedition to plan operations, including the recovery of seafloor instruments and was invaluable for revisiting specific sites, such as active bubble plumes, making the entire operation more efficient.
“It is quite amazing to see such large areas of the seafloor mapped visually, especially only days after the raw data was collected,” said Dr Thornton. “It is not just the size of the map, but also the way we were able to use it to inform our decisions while still on site. This makes a real difference as the technology makes it possible to visualise wide areas at very high resolution, and also easily identify and target areas where we should collect data. This has not previously been possible.”
Related Staff Member
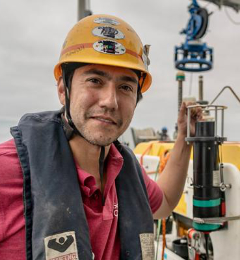
Professor Blair Thornton PhD
Blair Thornton is a Professor of Marine Autonomy within Engineering and Physical Sciences at the University of Southampton
Research Keywords: Marine Robotics, Computer Vision, Machine Learning, SLAM, Laser spectroscopy
Read moreLinks to external websites
The University cannot accept responsibility for external websites.