Nearly a fifth of world's ocean floor now mapped

As the Nippon Foundation-GEBCO (General Bathymetric Chart of the Oceans) Seabed 2030 project recently announced that almost one fifth of the world seabed has been mapped to their target standards, SMMI experts Tim Henstock and Blair Thornton provide further insight on Seabed 2030.
Tim Henstock, Professor of Geophysics said “The objective is that by 2030 all of the seabed will have the water depths measured with a cell spacing varying from 100mx100m in water shallower than 1500m to 800mx800m in the deepest trenches. The three quarters of the area that makes up water depths between 3000m and 5750m, such as the ocean abyssal plains, will have a cell spacing of 400mx400m. At the time the project was launched, data of this quality was only publically available for about one sixteenth of the seabed. While bathymetry maps are available of the whole of the oceans, the remaining four fifths of the area are based on either older soundings (some of them including lead-line data collected during the 1800s!) or interpolations guided by global-scale gravity models, that can only image features that are more than about 10km across. The increase in the higher quality data comes partly from new dedicated surveys, partly from older data being released into the public domain, and partly from survey vessels running their sonar equipment while travelling from one location to another.
“The Seabed 2030 specification is lower resolution than we need to study many geological features, and much too small for archaeology. Modern ship-borne multibeam sonar systems are capable of producing maps at a cell spacing of 50-100m in the abyssal plains, and 10s of cm if we are surveying close to the target (for example when mapping in water depths of 10-20m). In good conditions they are able to survey a “swath” of the seabed that has a width of up to seven times the water depth. However there are parts of the oceans that are remote from normal transit routes, and which are not likely to be visited for scientific projects within the next decade. So the target is still challenging, and will require new approaches such as autonomous mapping vessels with endurance over 60-70 days to achieve it.”
Blair Thornton, Associate Professor of Oceanic Engineering Science said “The seabed covers about 360 million square kilometers, 70% of the surface area of our planet. The current global picture we have of the seabed has been generated by interpolating sparse, unevenly distributed depth measurements that have been interpolated using satellite derived gravity observations. This picture consists of just 14 million data points with a spatial resolution of ~5 x 5km. GEBCO's plan will improve this picture significantly, increasing the number of data points to >2 billion by 2030. This is a huge improvement over what we have, and it is great to hear Seabed 2030 is on track to achieve this ambitious target.
“An important question we need to ask ourselves before we can say the seafloor has been "mapped" however, is how do we plan to use these maps? The average resolution of the Seabed 2030 map will have a resolution of approximately 400 x 400 m, increasing to 100 x 100 m in shallow areas under 1500 m in depth. This will definitely give us an unprecedentedly detailed overview of the distribution of seamounts, ridges and trenches and help sharpen the boundaries of territorial seas. However, there are many applications where even 100 x 100 m resolution is nowhere near the resolution that needed to say the seafloor has been mapped. For example, modern geological surveys and infrastructure planning surveys use maps with a resolution of several tens of centimetres to a couple of metres. Infrastructure inspection and ecological monitoring surveys often use maps with sub centimetre resolution. These maps are typically generated using autonomous surface and submersible vehicles. Since covering the entire seabed at these resolutions is not feasible (we'd need 360 trillion and 36 quadrillion data points respectively), what is needed is a hierarchical approach with detail in the places that will lead to the biggest gains. The outcomes of Seabed 2030 are sure to help the marine research community identify such high priority areas and help coordinate the efforts of a global community.
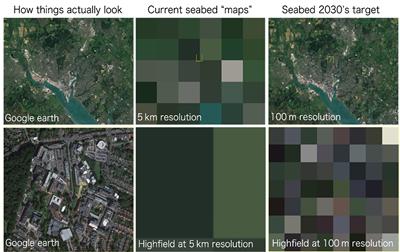
“The figure below attempts to illustrate this point. Seabed 2030 will give us a much more detailed overview, making objects the size of cities easier to recognise. However, we would be hard pressed to spot wrecks or plan infrastructure. For these tasks we need much higher resolutions, achievable by deploying robotic submersibles. Seabed 2030 will help us identify these areas and better coordinate efforts in observation.”