Initial MATLAB Code
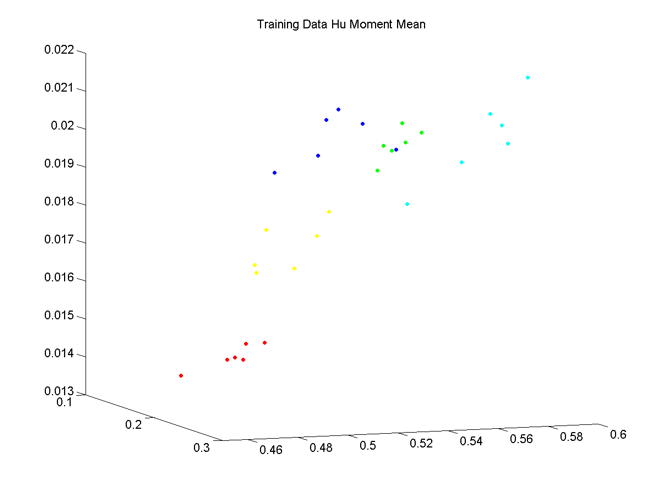
The initial work on Hu moments was developed in MATLAB. This allowed the rapid verification of the algorithm and development of a classification method. Below are Matlab plots of the mean and the training data, which show the grouping of the data.
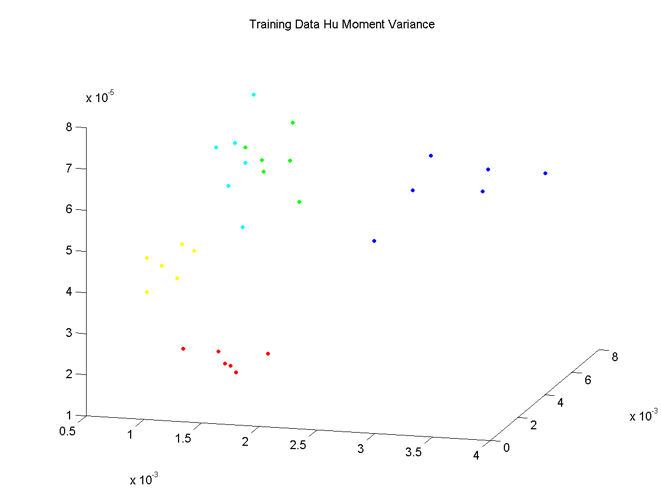
The plots show the mean and variance of the Hu moments of the training data, using the three moments as the three dimensions of the plot. This is similar to how they are projected in the feature space for classification, except that mean and variance are combined to give a 6-dimensional feature space. The different colours are assigned to different subjects to show the grouping of values for gaits of same subjects.
The Matlab code is provided with some test data.
Download the Matlab code: