Chapter 5: APPENDIXES
The following pages contain several appendices related to the thesis.
5.1. SUBJECTS INFORMATION SHEET
COGNITIVE EVENT RELATED POTENTIALS DURING A LEARNING TASK
We ask you to take part in this project entirely voluntarily. You can withdraw at any time, even after the recording has started, if you wish.
You are, of course, entitled to ask for more information but we cannot, obviously, tell you the difference between the two patterns you will be looking at, but you will give us your comments.
5.2. QUESTIONAIRE
NEUROLOGICAL ASPECT OF COGNITIVE RELATED POTENTIALS IN A LEARNING TASK
ID: --------------
Initials: -------------------- Surname: --------------------------
Age: Sex: Male Female
Address: ----------------------------------------------------------------------------
----------------------------------------------------------------------------------
Occupation: ------------------------------------------------------------------------
Special Habits: --------------------------------------------------------------------
Hand: Right ------- Left ------- Mixed -------
Height: ------- Weight: -------
Medical History:
--------------------------------------------------------------------------------------
--------------------------------------------------------------------------------------
--------------------------------------------------------------------------------------
Easy ------- Moderate ------- Difficult ------- Very Difficult ----
--------------------------------------------------------------------------------------
--------------------------------------------------------------------------------------
--------------------------------------------------------------------------------------
--------------------------------------------------------------------------------------
--------------------------------------------------------------------------------------
--------------------------------------------------------------------------------------
--------------------------------------------------------------------------------------
--------------------------------------------------------------------------------------
--------------------------------------------------------------------------------------
--------------------------------------------------------------------------------------
Date of the Test: ----/----/ 19
5.3. Edinburgh Handedness Inventory
Please indicate your preferences in the use of hands in the following activities by putting + in the appropriate column.
When preference is so strong that you would never try to use the other hand unless absolutely forced to, put ++.
If in any case you are really indifferent put + in both columns.
Some of the activities require both hands. In these cases the part of the task, or object, for which hand preference is wanted is indicated in brackets.
Please try to answer all the questions, and only leave a blank if you have no experience at all of the object of task.
|
Left |
Right |
||
|
1 |
Writing |
||
|
2 |
Drawing |
||
|
3 |
Throwing |
||
|
4 |
Scissors |
||
|
5 |
Toothbrush |
||
|
6 |
Knife (without fork) |
||
|
7 |
Spoon |
||
|
8 |
Broom (upper hand) |
||
|
9 |
Striking match (match) |
||
|
10 |
Opening Box (lid) |
Points scored = Sum of the number of (+) signs for each side.
Calculate the laterality percentage (%) as follow:
LP = (Number Of Points For Right - Number Of Points For Left)
/ Total No. Of Points Scored X 1005.4. The CuSum
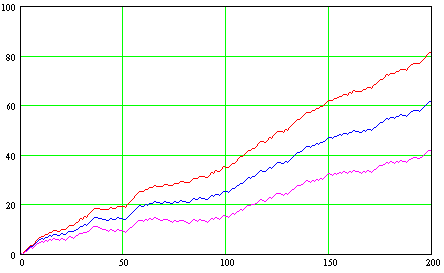
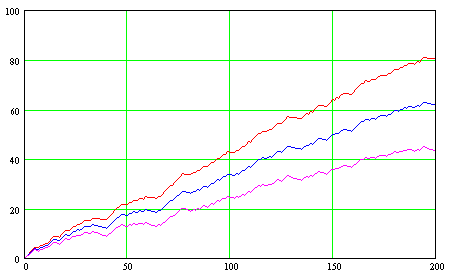
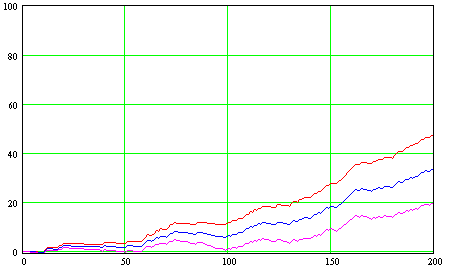
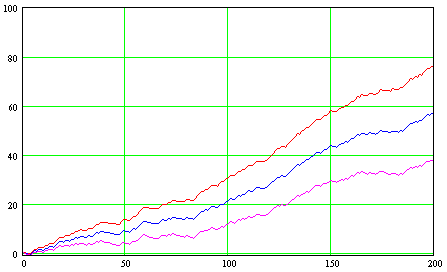
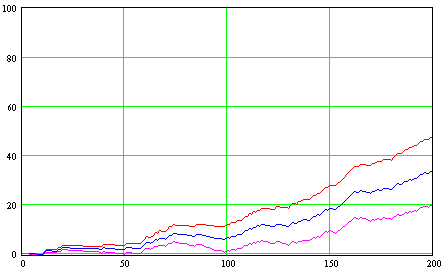
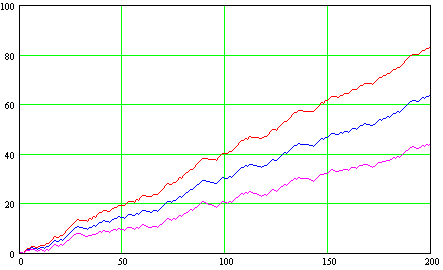
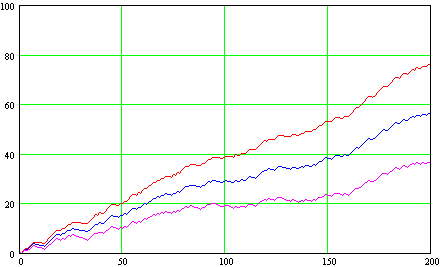
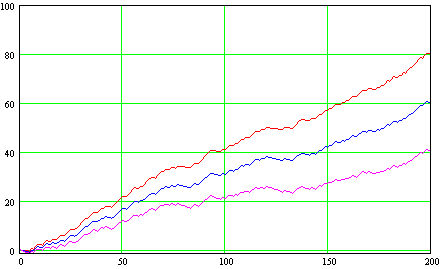
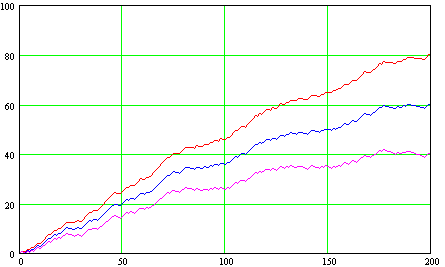
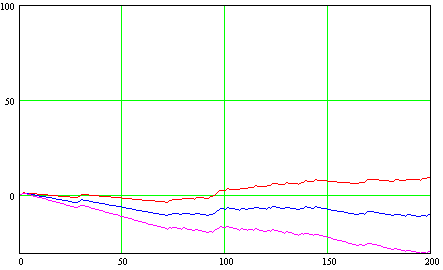
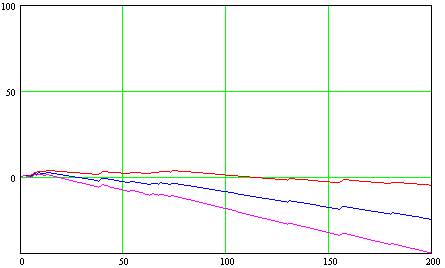
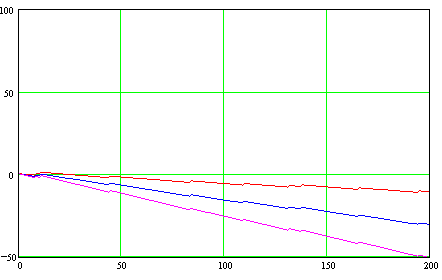
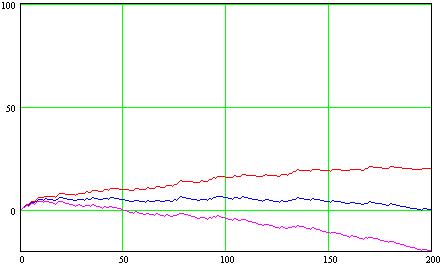
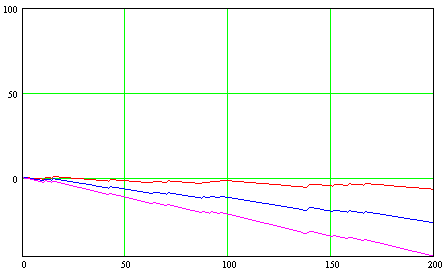
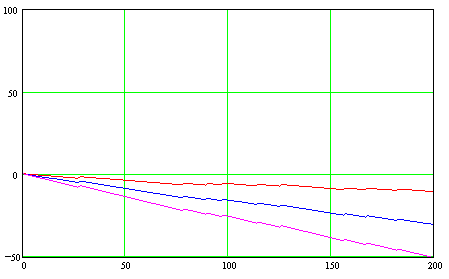
5.4.1. The cusum method:
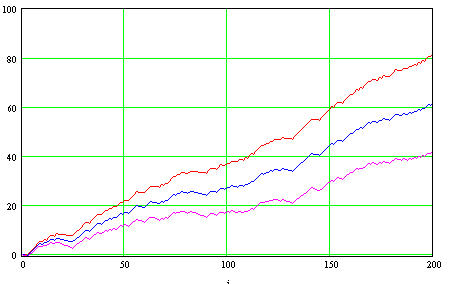
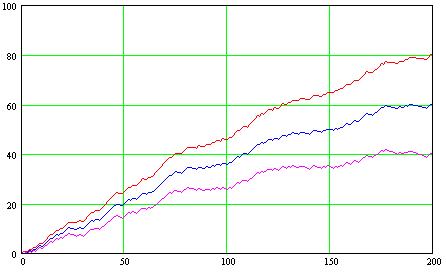
The CUSUM starts at zero, declining in the cusum trend indicate success, and an increasing in the cusum trend indicate failure.
This may be express mathematically as: -
CUSUM (i) =
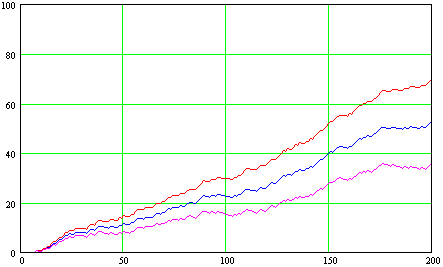
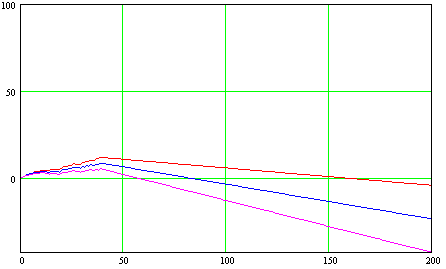
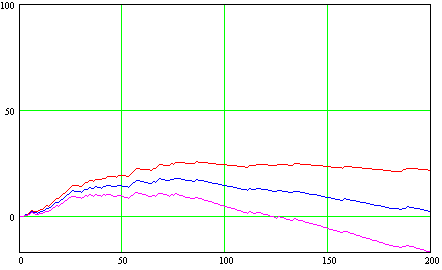
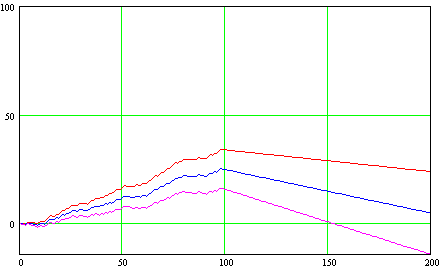
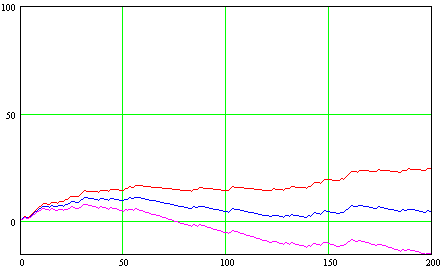
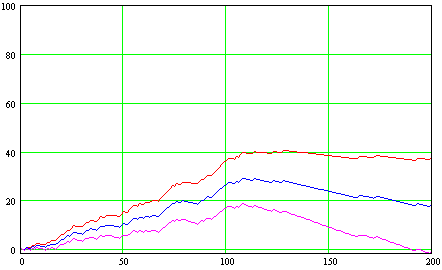
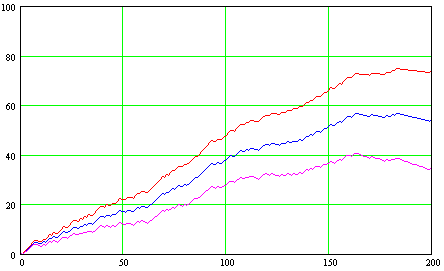
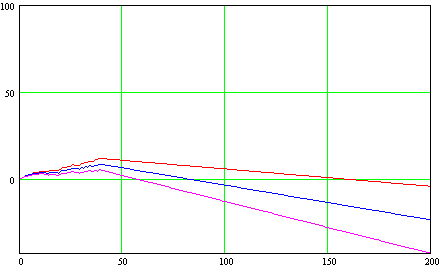
å (Result (i) - Tolerance)The performance of the subject is seldom perfect; it is usual to allow a certain tolerance 10% (0.1) failure rate (red line ). A subject performance with 90% success will generate a horizontal and the line will move above horizontal for a worse performance. Individual increments for the cusum would then be 1.0 - 0.1 = 0.9 for each failure, and 0 - 0.1 = -0.1 for each success, and the same equation for tolerance 20 % (blue line ), and tolerance 30% (pink line ).
For each graph:
Y-axis: represents the performance
X-axis: represents the 200 trials.
5.4.2. Cusum charts for the learning subjects
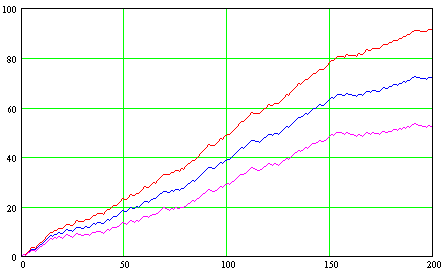
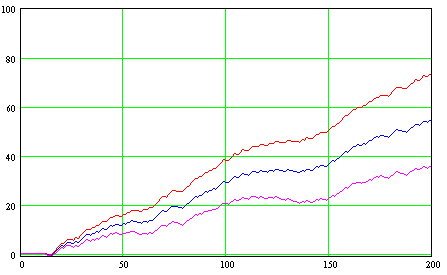
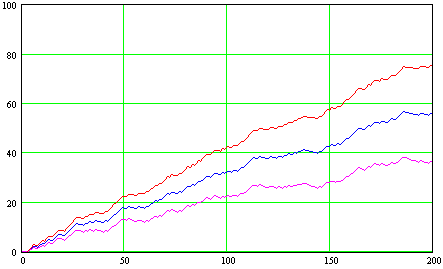
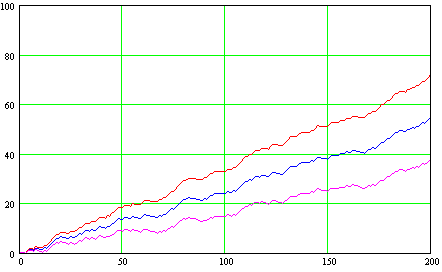
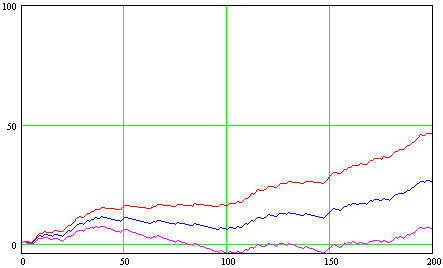
5.4.3. Cusum charts for the non-learning subjects:
5.5. Extra Results:
5.5.1. Subjects performance
|
GROUP |
Learners (LFr n=18) |
Non-learners (nLFr n=16) |
||
|
TRIALS |
CORRECT % |
INCORRECT % |
CORRECT % |
INCORRECT % |
|
01-010 |
57.5 |
38.0 |
39.4 |
51.3 |
|
11-020 |
58.9 |
39.4 |
46.3 |
46.3 |
|
21-030 |
60.4 |
36.2 |
43.1 |
48.8 |
|
31-040 |
61.5 |
33.4 |
51.9 |
44.4 |
|
41-050 |
64.9 |
34.4 |
46.3 |
49.4 |
|
51-060 |
68.9 |
27.8 |
51.9 |
46.3 |
|
61-070 |
68.9 |
32.9 |
46.9 |
51.3 |
|
71-080 |
64.3 |
33.9 |
54.4 |
42.5 |
|
81-090 |
64.4 |
36.7 |
51.3 |
45.0 |
|
91-100 |
74.4 |
23.3 |
50.0 |
46.9 |
|
101-110 |
76.7 |
23.1 |
49.4 |
45.0 |
|
111-120 |
70.9 |
22.4 |
47.5 |
50.6 |
|
121-130 |
77.2 |
21.1 |
51.9 |
45.0 |
|
131-140 |
75.7 |
24.3 |
58.8 |
40.6 |
|
141-150 |
78.7 |
20.2 |
49.4 |
49.4 |
|
151-160 |
78.6 |
20.8 |
50.6 |
46.3 |
|
161-170 |
78.6 |
20.9 |
50.6 |
40.6 |
|
171-180 |
78.6 |
20.3 |
45.6 |
46.9 |
|
181-190 |
80.4 |
18.0 |
46.3 |
46.9 |
|
191-200 |
85.6 |
14.4 |
50.0 |
41.9 |
|
TOTAL |
71.3 |
27.0 |
49.1 |
46.3 |
Table 5.5.1.1. Shows the performance data comparison for the learners (L) and non-learners (nL) in the first group (Fr). With feedback (F) and without rule (r ).
|
TRIALS |
Learners (LFR n= 5) |
|
|
CORRECT % |
INCORRECT % |
|
|
01-010 |
70.0 |
15.5 |
|
11-020 |
75.2 |
14.2 |
|
21-030 |
73.1 |
19.2 |
|
31-040 |
94.9 |
4.2 |
|
41-050 |
83.3 |
12.5 |
|
51-060 |
88.2 |
10.1 |
|
61-070 |
90.8 |
7.5 |
|
71-080 |
83.3 |
15.0 |
|
81-090 |
79.3 |
16.0 |
|
91-100 |
70.6 |
21.0 |
|
101-110 |
79.8 |
17.6 |
|
111-120 |
83.5 |
15.7 |
|
121-130 |
76.7 |
20.8 |
|
131-140 |
79.3 |
16.7 |
|
141-150 |
94.0 |
5.1 |
|
151-160 |
86.9 |
9.8 |
|
161-170 |
86.2 |
13.8 |
|
171-180 |
94.2 |
3.8 |
|
181-190 |
94.1 |
3.9 |
|
191-200 |
89.5 |
9.8 |
|
TOTAL |
83.6 |
12.6 |
Table 5.5.1.2. Shows the performance data comparison for the learners (L) in the second group (FR). With feedback (F) and with rule (R)
|
TRIALS |
Learners (Lfr n = 8) |
Non-learners (nLfr n = 16) |
||
|
CORRECT % |
INCORRECT % |
CORRECT % |
INCORRECT % |
|
|
01-010 |
55.2 |
27.1 |
50.1 |
36.8 |
|
11-020 |
58.9 |
15.2 |
54.1 |
33.5 |
|
21-030 |
63.2 |
24.9 |
47.2 |
38.7 |
|
31-040 |
54.9 |
40.3 |
41.5 |
37.9 |
|
41-050 |
78.9 |
10.9 |
36.5 |
48.8 |
|
51-060 |
54.6 |
35.2 |
40.1 |
46.8 |
|
61-070 |
79.3 |
19.8 |
43.4 |
47.8 |
|
71-080 |
50.4 |
30.1 |
43.7 |
46.5 |
|
81-090 |
64.5 |
25.9 |
47.2 |
43.2 |
|
91-100 |
65.3 |
30.1 |
45.9 |
44.1 |
|
101-110 |
73.3 |
21.0 |
45.8 |
39.5 |
|
111-120 |
76.9 |
20.0 |
36.7 |
52.7 |
|
121-130 |
78.9 |
20.1 |
49.2 |
42.1 |
|
131-140 |
78.9 |
21.3 |
50.9 |
38.9 |
|
141-150 |
77.5 |
11.2 |
52.9 |
35.9 |
|
151-160 |
78.3 |
12.2 |
46.3 |
43.8 |
|
161-170 |
78.9 |
13.5 |
42.3 |
49.1 |
|
171-180 |
79.7 |
17.6 |
41.1 |
47.9 |
|
181-190 |
76.4 |
10.9 |
48.5 |
40.1 |
|
191-200 |
78.1 |
4.8 |
45.6 |
39.5 |
|
TOTAL |
70.1 |
20.6 |
45.4 |
42.6 |
Table 5.5.1.3. Shows the performance data comparison for the learners (L) and non-learners (nL) in the third group (fr), Without feedback (f) and without rule (r)
|
TRIALS |
Learners (LfR n = 6) |
Non-learners (nLfR n = 9) |
||
|
CORRECT % |
INCORRECT % |
CORRECT % |
INCORRECT % |
|
|
01-010 |
59.2 |
20.0 |
58.1 |
13.2 |
|
11-020 |
66.9 |
7.5 |
60.0 |
29.9 |
|
21-030 |
70.1 |
10.0 |
64.9 |
29.9 |
|
31-040 |
66.9 |
20.0 |
61.9 |
10.2 |
|
41-050 |
75.2 |
12.5 |
54.9 |
30.2 |
|
51-060 |
72.3 |
7.5 |
66.8 |
30.1 |
|
61-070 |
70.1 |
12.5 |
60.0 |
5.2 |
|
71-080 |
84.2 |
7.3 |
55.1 |
29.9 |
|
81-090 |
71.9 |
20.0 |
60.0 |
34.8 |
|
91-100 |
70.1 |
15.0 |
50.0 |
25.9 |
|
101-110 |
74.9 |
12.0 |
55.2 |
34.9 |
|
111-120 |
79.9 |
10.0 |
54.6 |
45.6 |
|
121-130 |
74.8 |
7.3 |
50.0 |
40.4 |
|
131-140 |
70.2 |
7.5 |
60.0 |
25.8 |
|
141-150 |
75.1 |
20.0 |
59.3 |
18.3 |
|
151-160 |
80.1 |
15.0 |
48.1 |
50.2 |
|
161-170 |
75.1 |
18.0 |
55.2 |
40.6 |
|
171-180 |
76.9 |
15.0 |
60.0 |
55.5 |
|
181-190 |
78.9 |
20.0 |
61.2 |
35.2 |
|
191-200 |
80.1 |
18.0 |
59.5 |
30.2 |
|
TOTAL |
73.6 |
13.8 |
57.7 |
30.8 |
Table 5.5.1.4. Shows the performance data comparison for the learners (L) and non-learners (nL) in the fourth group (fR). Without feedback (f) and with rule (R)
5.5.2. Learner's Event related potentials
In each group we investigate the electrodes locations for within the learners during two different set of experimental conditions (First quartile (Q1) with the fourth quartile (Q4) and (Correct answer trials with the incorrect answers trials during) by using two ways ANOVA repeated measures (experiment conditions X electrodes Locations) tables (5.5.2.1, 2, 3, & 4.) The results revealed that there were statistically significant differences for the central, right-hand side, and all electrodes locations in all four groups (Fr, FR, fr, fR). There was no statistically significant difference for the left-hand side locations except in group FR.
For the experiment conditions correct answers and the incorrect answers the results revealed that there were statistically significant differences when compared by the central, right-hand side, left-hand side, and all electrodes locations
|
Experimental condition |
Correct / Incorrect answers |
First Quartile / Fourth Quartile |
||||
|
Group |
DF |
F |
p value |
DF |
F |
p value |
|
LFr n=18 |
(1,17) |
132.41 |
0.001 |
(1,17) |
65.44 |
0.001 |
|
LFR n=15 |
(1,14) |
97.70 |
0.001 |
(1,14) |
103.22 |
0.001 |
|
Lfr n=8 |
(1, 7) |
7.98 |
0.03 |
(1, 7) |
8.49 |
0.03 |
|
LfR n=6 |
(1,5) |
5.16 |
0.05 |
(1,5) |
4.49 |
0.06 |
Table (5.5.2.1.) shows two ways repeated measures ANOVA test within subject effects of the learners in each group for the central electrodes locations (FPZ, FZ, FCZ, CZ, PZ, POZ, OZ)
|
Experimental condition |
Correct / Incorrect answers |
First Quartile / Fourth Quartile |
||||
|
Group |
DF |
F |
p value |
DF |
F |
p value |
|
LFr n=18 |
(1,17) |
89.63 |
0.001 |
(1,17) |
56.60 |
0.06 |
|
LFR n=15 |
(1,14) |
57.92 |
0.01 |
(1,14) |
70.52 |
0.01 |
|
Lfr n=8 |
(1, 7) |
20.91 |
0.03 |
(1, 7) |
14.20 |
0.07 |
|
LfR n=6 |
(1,5) |
7.05 |
0.11 |
(1,5) |
8.70 |
0.09 |
Table (5.5.2.2.) shows two ways repeated measures ANOVA test within subject effects of the learners in each group for left-hand side electrodes locations (F3, F7, ATL, C3, T3, T5, TPL, P3, O1,)
|
Experimental condition |
Correct / Incorrect answers |
First Quartile / Fourth Quartile |
||||
|
Group |
DF |
F |
p |
DF |
F |
p |
|
LFr n=18 |
(1,17) |
142.2 |
0.001 |
(1,17) |
118,30 |
0.001 |
|
LFR n=15 |
(1,14) |
129.45 |
0.001 |
(1,14) |
81.16 |
0.001 |
|
Lfr n=8 |
(1, 7) |
14.48 |
0.007 |
(1, 7) |
9.36 |
0.01 |
|
LfR n=6 |
(1,5) |
6.62 |
0.03 |
(1,5) |
6.38 |
0.03 |
Table (5.5.2.3.) shows two ways repeated measures ANOVA test within subject effects for the learners in each group by the right-hand side electrodes locations (F4, F8, ATR, C4, T4, T6, TPR, P4, O2).
|
Experimental condition |
Correct / Incorrect answers |
First Quartile / Fourth Quartile |
||||
|
Group |
DF |
F |
p value |
DF |
F |
p value |
|
LFr n=18 |
(1,17) |
134.3 |
0.001 |
(1,17) |
99.90 |
0.01 |
|
LFR n=15 |
(1,14) |
92.11 |
0.005 |
(1,14) |
53.37 |
0.04 |
|
Lfr n=8 |
(1, 7) |
11.53 |
0.01 |
(1, 7) |
10.24 |
0.02 |
|
LfR n=6 |
(1,5) |
5.98 |
0.05 |
(1,5) |
5.43 |
0.01 |
Table (5.5.2.4.) shows two ways repeated measures ANOVA test within subject effects of the learners in each group for the all electrodes locations (F3, F4, F7, F8, ATL, ATR, C3, C4, T3, T4, T5, T6, TPL, TPR, P3, P4, O1, O2, FPZ, FZ, FCZ, CZ, PZ, POZ, OZ).
Tables (5.5.2.5, 6, 7, & 8) show the Statistical analysis of the difference between subjects brain activity while performing the task for each quartile (50 trials), (Q1, Q2, Q3, Q4) X Electrodes locations using two ways repeated measures ANOVA revealed a significant differences of brain activity during quartiles X location. Inspection of these results suggests that the bulk of the within quartile learning effect was restricted to the Fr, and FR groups especially during the last quartile.
Analyzing each group separately supported this impression when the effect of learning across the quartiles was analyzed for group FR. Group fr only showed that there was no significant increasing in the brain activity across the quartile. There was significant increasing in the brain activities of Fr, FR and fR groups from Q1 across to Q4. The ERP for the all-individual electrodes were entered into experiment conditions (Q1, Q2, Q3, and Q4) ANOVA: Significant differences emerged between the ERP elicited by learning processes for each quartile. We can infer that any improvement and changes in the brain activity was transferred from previous learning rather than constituting new learning within that quartile.