Chapter3: RESULTS
3.1. General results:
Event related potentials were recorded from 24 scalp electrodes on ninety-nine normal healthy adult volunteers. They were aged from 18 years to 34 years (Mean 23.15 ± 3.21). There were 44 females (23.25 ± 2.83) and 55 males (23.07 ± 3.52). All subjects had normal visual acuity or corrected to normal.
Table 3.1.1. Summarizes the numbers of the female and male volunteers distributed in each group according to their age range. The first group (Fr n= 34) the females were 15 and they were aged 19-29 years, and the 19 males aged 18-34 years. The second group (FR n=15) 7 females aged 19-24 years and the males were 8 aged 18-24 years. The third group (fr n=24) there were 10 females aged 20-28 years and 14 males aged 19-27 years. The fourth group (fR n=15) 7 females aged 19-24 years and 8 males aged 18-24 years. The fifth group (observers n=11) 5 females aged 18-29 and there were 6 males aged 18-30 years. With feedback (F), without feedback (f). With rule (R), and without rule (r).
|
SEX |
FEMALES |
MALES |
Total |
||
|
Number |
Age |
Number |
Age |
-------------- |
|
|
F r |
15 |
21 - 29 |
19 |
21 - 34 |
34 |
|
F R |
7 |
19 - 24 |
8 |
18 - 24 |
15 |
|
f r |
10 |
20 - 28 |
14 |
19 - 27 |
24 |
|
f R |
7 |
19 - 24 |
8 |
18 - 24 |
15 |
|
Observers |
5 |
19 - 29 |
6 |
18 - 30 |
11 |
|
Total |
44 |
----------- |
55 |
------------ |
99 |
Table (3.1.1.) shows the numbers of the participant distribution and age range for the females and males in all groups. With feedback (F) without feedback (f) with rule (R), and without rule (r).
Table 3.1.2. Summarizes the age means
± standard deviations comparison between the learners (L) and non-learners (nL) in each of the experiments groups. There was no statistical significant difference between the ages of learners and non-learners in any of these groups. With feedback (F) without feedback (f) with rule (R), and without rule (r)
|
GROUPS |
LEARNERS (L) |
NON-LEARNERS (nL) |
|
Group 1 (Fr) |
25.70 ± 3.08 |
24.10 ± 2.90 |
|
Group II (FR) |
21.13 ± 2.23 |
------------------- |
|
Group III (fr) |
23.70 ± 3.24 |
23.00 ± 2.00 |
|
Group IV (fR) |
20.17 ± 2.40 |
21.00 ± 2.24 |
Table (3.1.2.) shows the mean and standard deviation of age for the learners and non-learners in all groups. With feedback (F) without feedback (f) with rule (R), and without rule (r)
P value
£ 0.05, £ 0.01, £ 0.001.
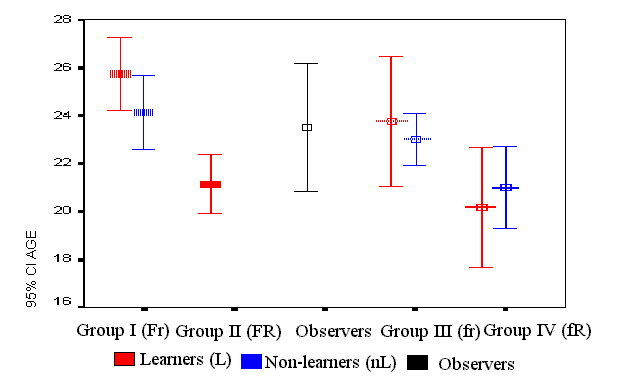
Figure 3.1.1. Shows an error bar chart representing the mean, confidence intervals (95%) and standard errors for the learners and non-learners age in each experimental group. There were no statistical significant differences.
Figure 3.1.2, and figure 3.1.3. Show the error bar charts representing the mean, and standard deviations of age for the females and males according to them classification as learners or non-learners in each experimental group. There were no statistically significant differences.
Figure 3.1.1. Shows the error bar chart of the mean age for the learners in red and non-learners in blue and the observers in black. Y-axis represents the mean and confidence interval (CI). X-axis represents the different experiments group. Thick line with feedback (F) thin line without feedback (f). Solid line with rule (R), and interrupted line without rule (r)
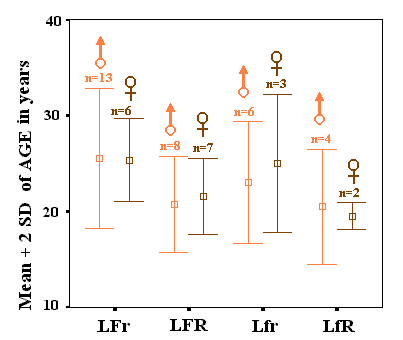
Figure 3.1.2. Show the error bar chart of the mean of age for the learner's females in brown and the learner's males in light brown. Y-axis represents the mean and two standard deviations. X-axis represents the different experiments group. Thick line with feedback (F) thin line without feedback (f). Solid line with rule (R), and interrupted line without rule (r)
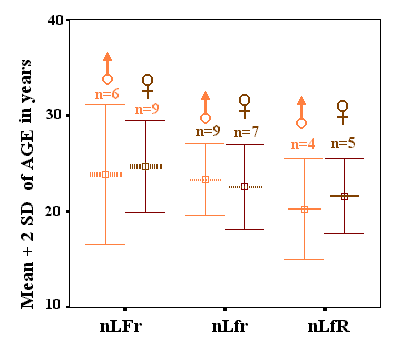
Figure 3.1.3. Show the error bar chart of the mean of age for the non-learner's females in brown and the non-learner's males in light brown. Y-axis represents the mean and two standard deviations. X-axis represents the different experiments group. Thick line with feedback (F) thin line without feedback (f). Solid line with rule (R), and interrupted line without rule (r)
3.2. Performance Results:
3.2.1. Learning performance:
My five experiments divided the 99 participants into five groups and three of these groups subdivided into two subgroups of learners and non-learners. Table (3.2.1.) summarizes all participants' performance.
According to the questionnaire II, the learners in-group I (LFr) concluded, that the task was for 5% very difficult, for 40% difficult, for 35% moderate and for 25% easy. Group II (LFR) who got the details before performing the task concluded that it was easy. Group III (Lfr) concluded, that the task was for 80% very difficult, for 15% difficult, and for 5% moderate. Group IV (LfR) concluded that it is very difficult by 55%, and difficult by 20%, 15% moderate, and 10% easy. The most interesting observation that all of the non-learners reported that the task was very difficult.
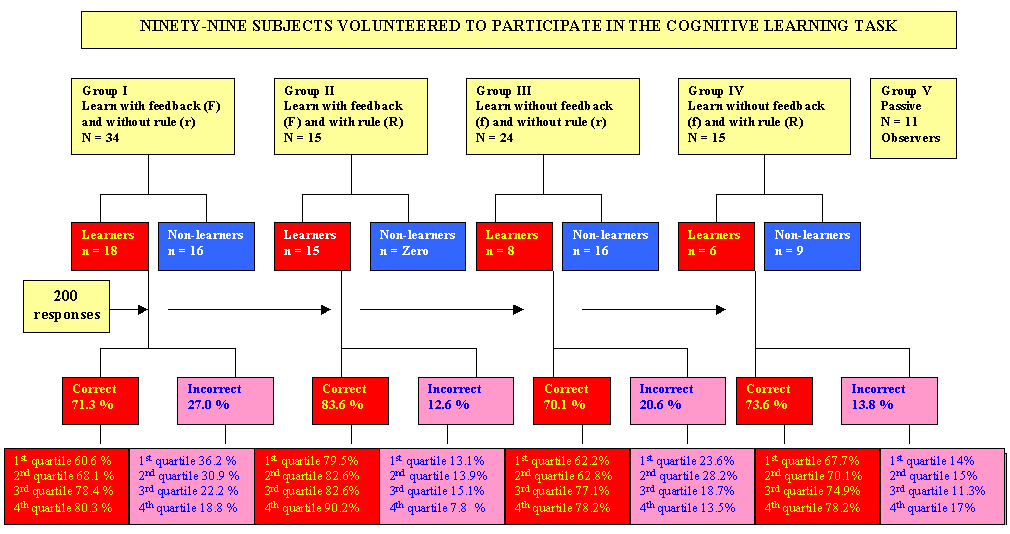
Table 3.2.1. Summarizes the all participants' performance
About half of the subjects were learners (53 %) in the first group (Fr n=34), all of them were (100 %) learners in the second group (FR n=15), for the third group (fr n= 24) only about third of the subjects were learners (33 %) and the fourth group (fR n= 15) the learners percentage were (40 %) figure 3.2.1a.
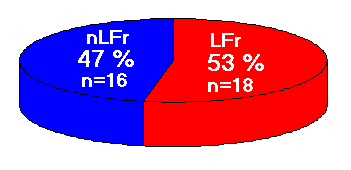
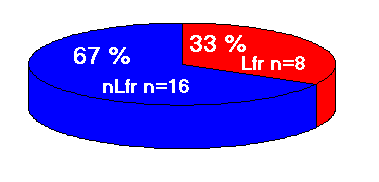
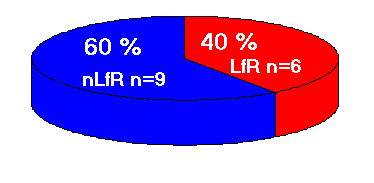
Figure 3.2.1a. Shows the distribution of the learners (L) represented in red color and non-learners (nL) represented in blue color in every group, whereas F with feedback & f without feedback, and R with rule & r without rule
The cut off point for learning was set at 70% correct answers of the last fifty trials. The learning profile was divided into two categories, the learners (L) and the non-learners (nL). Figure (3.2.1.) shows the numbers of subjects (females and males) meeting the 70% criterion.
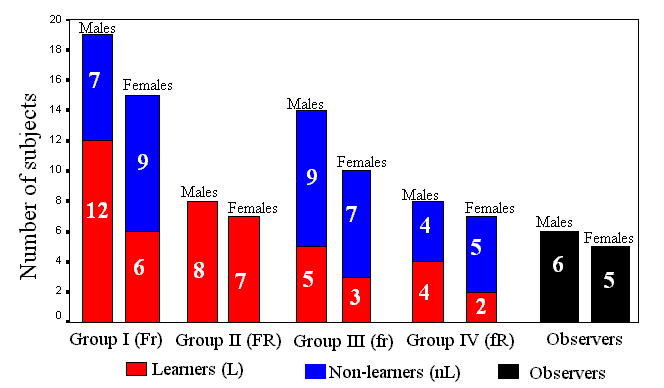
Figure 3.2.1. Summarizes the females and males distribution according to their performance in each group. Learners (L) in red, Non-learners (nL) in blue, and Observers in black. Y-axis represents the number of subjects. X-axis represents the females and males in different experiments group.
The subjects performed three responses, correct (when they made the right decision), incorrect (when they made the wrong decision), and no response (when they did not press any button within the image display time). Criteria of 70% correct answers during the last fifty trials answers were set for learning.
A clear divide was seen between the learners (LFr) and the non-learners (nLFr) in the first group where seven out of the eighteen learners performance only was 70%, three out of sixteen non-learners correct answers were ranged from 50% to 59% during the last fifty trials (Figure 3.2.2.). Three out of sixteen non-learners (nLfr) in the third group correct answers were ranged from 50% to 59% and five out of eight them correct answers percentage ranged between 70% and 79% during the last fifty trials (Figure 3.2.3.). None of the non-learners in these two groups have got more than 60% correct answers. One out of nine non-learners in the fourth group (nLfR) got over 60% correct answers (Figure 3.2.4.).
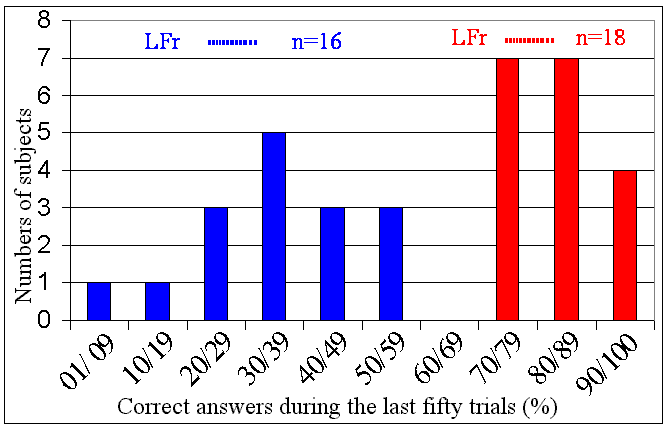
Figure 3.2.2. shows the first group
learners (LFr n=18) in red and the non-learners (nLFr n=16) in blue correct answers performance percentage during the last fifty trials of the learning task. Y-axis represents number of subjects. X-axis represents correct answers percentage during the last fifty trials. With feedback (F) and without rule (r).
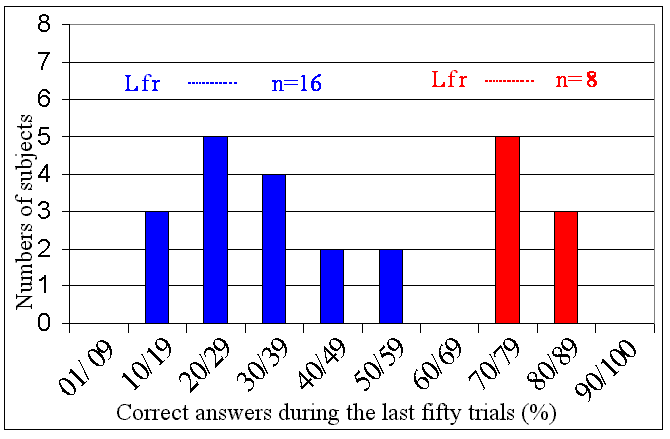
Figure 3.2.3. shows the third group
learners (Lfr n=8) in red and the non-learners (nLfr n=16) in blue correct answers performance percentage during the last fifty trials of the learning task. Y-axis represents number of subjects. X-axis represents correct answers percentage during the last fifty trials. Without feedback (f) and without rule (r).
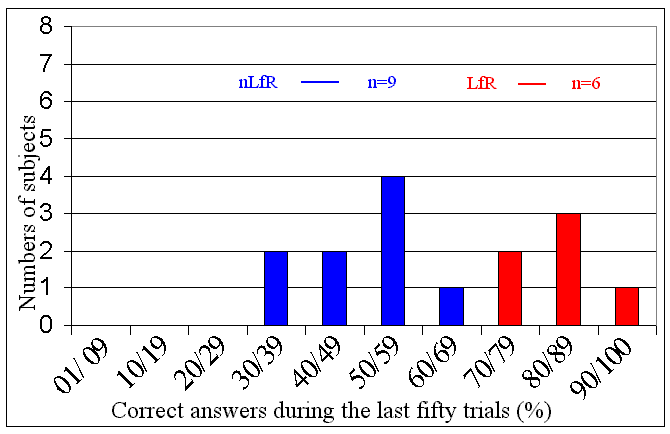
Figure 3.2.4. shows the fourth group learners (LfR n=6) in red and the non-learners (nLfR n=9) in blue correct answers performance percentage during the last fifty trials of the learning task. Y-axis represents number of subjects. X-axis represents correct answers percentage during the last fifty trials. Without feedback (f) and with rule (R).
3.2.2.Cusum charts:
The Cusum statistical method was used to assess the subject’s performance. Cusum charts for some of learners and non-learners subject can be seen in appendix No 3.
The Cusum charts by visual inspection showed that all subjects have relatively poor performance at the beginning of the trials. (Figures 3.2.5. & 3.2.6.).
The cusum charts for the learners and non-learners show that each subjects starts with a score of zero. Each trial earns a score of 1-tolerance level, for a correct answers, and 0-tolerance level for an incorrect answer. The score for each trial is added to the one before giving the Cumulative Sum. The CUSUM graphs have three lines for tolerance level of 30% in pink color, 20% in blue color, 10% in red color.
For the learners they were effective after the first fifty trials. Figure 3.2.8. Shows a learner who performs badly during the first 150 trials (1st, 2nd, and 3rd quartiles) but then the graph turns to give a consistently positive gradient indicating that the learning criterion has been achieved, where the subject had got the clue.
There were some subjects in non-learning group who seemed to have learned early and perform well over the first and second quartiles, and with some hesitation in the middle, but the curve becomes horizontal or descends during the last fifty trials and the subject has not learned (Figure 3.2.6.).
A typical cusum chart is shown from non-learner who struggles to achieve the required success, good starts during the first fifty and then the subject is clearly failing throughout the trials with very bad performance to the end of the task (Figure 3.2.7.), whereas figure (3.2.8.) appeared to learn early with a very good performance for one of the learner who scored consistently well from about the eighty trials onward to the end.
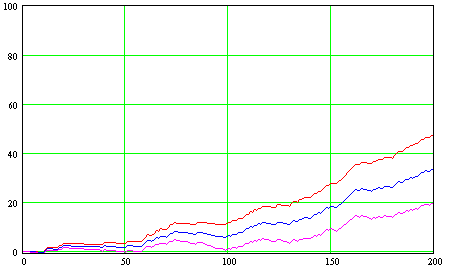
Figure 3.2.5. Cusum chart for learner, the three lines for tolerance level of 30% in red color, 20% in blue color, and 10% in pink color. X-axis represents the task trials, Y-axis represents the subject performance.
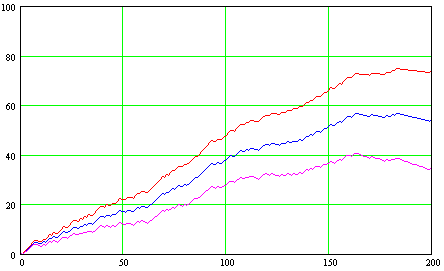
Figure 3.2.6. Cusum chart for non-learner, the three lines for tolerance level of 30% in red color, 20% in blue color, and 10% in pink color. X-axis represents the task trials; Y-axis represents the subject performance.
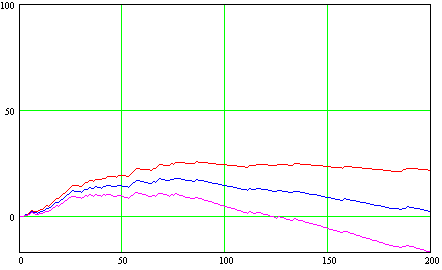
Figure 3.2.7. Cusum chart for non-learner, the three lines for tolerance level of 30% in red color, 20% in blue color, and 10% in pink color. X-axis represents the task trials, Y-axis represents the subject performance.
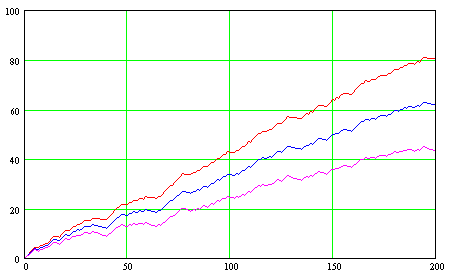
Figure 3.2.8. Cusum chart for learner, the three lines for tolerance level of 30% in red color, 20% in blue color, and 10% in pink color. X-axis represents the task trials; Y-axis represents the subject performance.
3.2.3. The Correct answers:
The learners performance shows steady increase, and as expected the non-learners exhibited no start to finish difference (see learning curves, Figure 3.2.9.), that summarizes the learning curves for the learners in red color lines and the non-learners in blue color lines during the learning trials for each group.
Figure (3.2.10.) shows that the learners in first group (LFr n=18) represented by thick interrupted line where their performance started just below 60% correct answers. Beyond the middle trials answers they never fell under 70% correct answers to the end of the task and they finished at the top of all other groups except the second (LFR).
Figure (3.2.11.) shows the learners in the second group represented by the solid thick line (LFR n=15) and their steady increase in average performance. They had the highest start score and from the beginning and they never fell fewer than 70% correct answers. Twice during the trial they achieved scores of over 90% in the first half of the task and the end score was 89.5% correct answers
Figure (3.2.12.) shows that the third group (Lfr n=8), that performed the task with neither information nor feedback. They started with 55.2% correct answers and after few trials the curve morphology looks like a zigzag in shape to the end of the second quarter (second fifty), and they reached 80% correct answers during the first two quarters but this level was not sustained. They started the third quarter at 65 % and ended the last one or the task at 78.1% correct answers.
Figure (3.2.13.) shows that the fourth group learners (LfR n=6) knew the rule but had no feedback. Thin solid line represents their performance and shows a very close start 59.2% correct answers to the learners in the first and fourth group and even the non-learners of the same group. The end correct answers trials percentage of 80.1% was very close as well to the fourth group (Lfr). Their curve morphology looks like the second group curve morphology but it was very different in the correct answers percentage which is lower in the case of the fourth group condition (LfR).
The learning curve for the all non-learners is represented in blue line color and shows their performance while they were trying to learn the difference between pattern A and B throughout the all trials. Group I non-learners (nLFr n=16) represented by the interrupted thick blue line, there is no difference from the start to finish trials figure (3.2.11.). The non-learners in group III (nLfr n=16) that perform without no idea about the task and feedback not given as well, they are represented by a interrupted thin line figure (3.2.12.). The thin solid line represents the non-learners in fourth group (nLfR n=9) that had only one of the all clues to make achievement. Although they did show very good start (59.2 % correct answers), they could not able to keep going in the same direction and they made much wrong decision in the middle of the trial. They tried to catch up near the end but they could not able to do more than 70%. Figure (3.2.13.). For the all learners and non-learners in each group see also figure 3.2.9.
The subjects in group one (Fr). There was a steady increase in learner’s average performance. As expected, the non-learners exhibited no start to finish difference. A middle period of above chance level was shown reaching the 70% criteria set for the learners. The percentage for non-learners incorrect answers were 46.3 % and were lesser for learners 27.0%, but for the correct answers percentage were 71.3 for learners and were less for non-learners 49.1 % for whole experiment see appendix 5 Table (5.5.1.).
Table (3.2.2.) shows that the learners and non-learners correct answers for type A (36.5% & 26.9%) were more than for type B (34.8% & 22.2%) respectively. Incorrect answers for both groups were learners and non-learners (12.2% & 20.7%) respectively for type A and were more for type B (14.8% & 25.6%).
Figure (3.2.9.) shows the subjects performance during a learning task. Y-axis represents the correct answers responses percentage. X axis represents task trials number.
Learners in red color (L). Non-learners in blue color (nL). Thick line with feedback (F), thin line without feedback (f). Solid line with rule (R), interrupted line without rule (r).The second group (FR) which has all learners as subjects, the percentage of the correct answers was 70% at the first ten trials and never been under 70% through the all trials. The average percentage of the correct answers was 83.6% and was 12.6 in the case of the incorrect answers, see appendix 5 Table (5.5.2.).
Table (3.2.3.) shows that the learners correct and incorrect answers percentage for type A were (42.1% & 6.4%) where were for type B (41.5% & 6.2%).
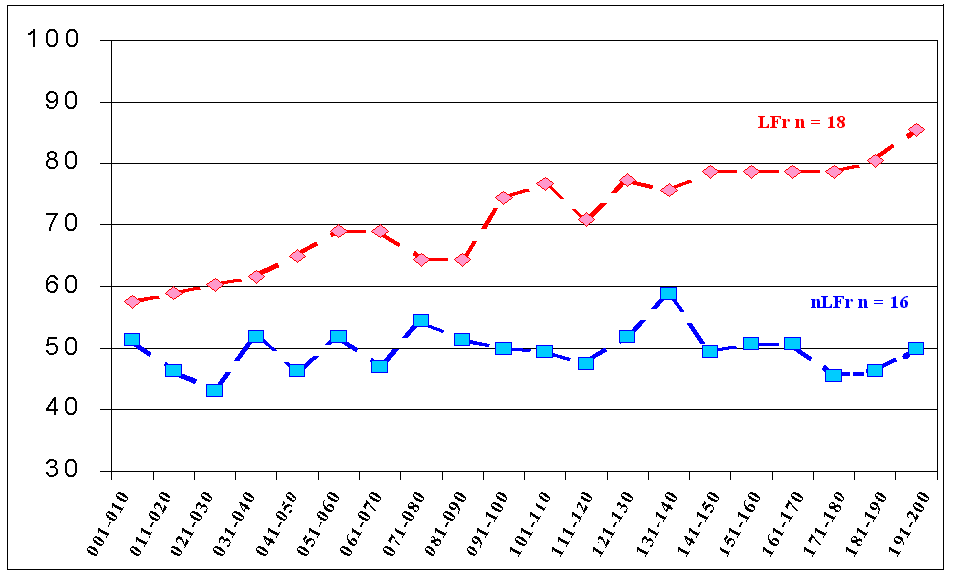
Figure 3.2.10. Shows the subjects performance during a learning task. Y-axis represents the correct answers responses percentage. X axis represents task trials number.
Learners in red (L). Non-learners in blue (nL). Thick line with feedback (F), and interrupted line without rule (r) representing group I (Fr).
Figure 3.2.11. Shows the subjects performance during a learning task. Y-axis represents the correct answers responses percentage. X axis represents task trials number.
Learners in red (L). Thick line with feedback (F), and solid line with rule (R), representing group II (FR).
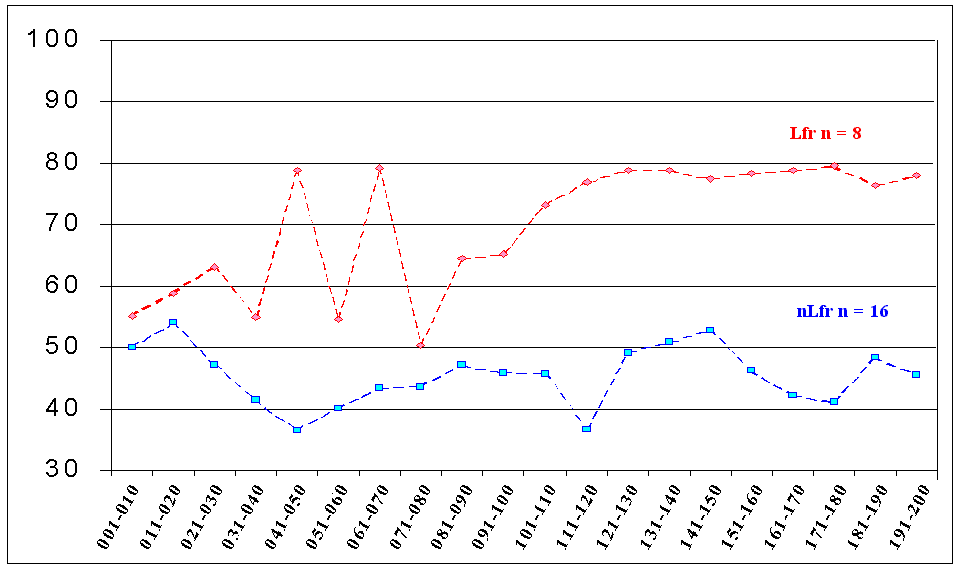
Figure 3.2.12. Shows the subjects performance during a learning task. Y-axis represents the correct answers responses percentage. X axis represents task trials number.
Learners in red (L). Non-learners in blue (nL). Thin line without feedback (f) and interrupted line without rule (r) representing group (fr).
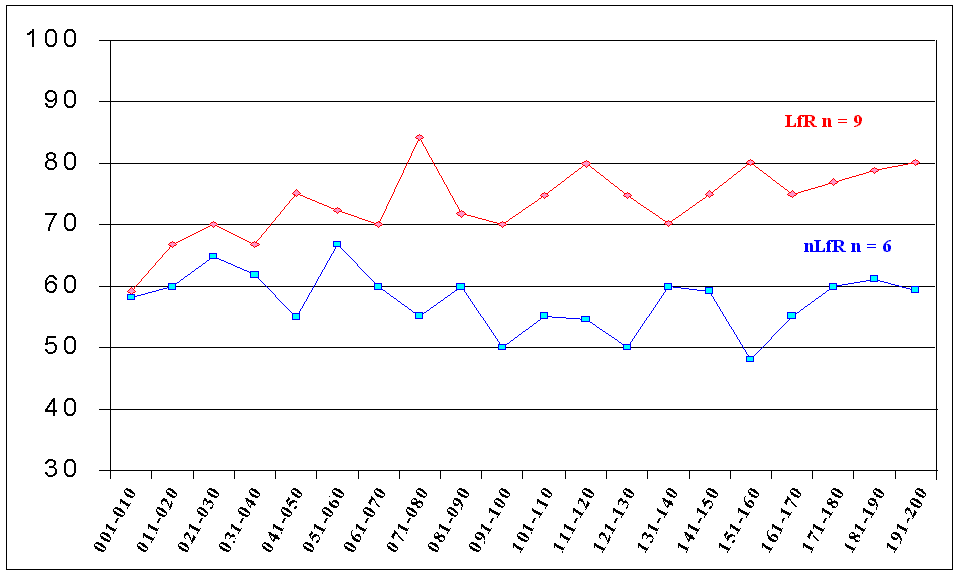
Figure 3.2.13. Shows the subjects performance during a learning task. Y-axis represents the correct answers responses percentage. X axis represents task trials number.
Learners in red (L). Non-learners in blue (nL). Thin line without feedback (f), and solid line with rule (R), representing group IV (fR).|
RESPONSES |
Learners (LFr n= 18) |
Non-learners (nLFr n= 16) |
||||
|
TYPE % |
TYPE A |
TYPE B |
Total |
TYPE A |
TYPE B |
Total |
|
CORRECT |
36.5 |
34.8 |
70.3 |
26.9 |
22.2 |
49.1 |
|
INCORRECT |
12.2 |
14.8 |
27.0 |
20.7 |
25.6 |
46.3 |
|
NO RESPONSE |
1.3 |
1.4 |
2.7 |
2.4 |
2.2 |
4.6 |
Table (3.2.2.) shows type A, B and the total responses data comparison for the learners (L) and the non-learners (nL) in the first group (Fr). With feedback (F) and without rule (r)
|
RESPONSES |
Learners (LFR n= 15) |
||
|
TYPE |
TYPE A % |
TYPE B % |
Total % |
|
CORRECT |
42.1 |
41.5 |
83.6 |
|
INCORRECT |
6.4 |
6.2 |
12.6 |
|
NO RESPONSE |
1.7 |
2.1 |
3.8 |
Table (3.2.3.) shows type A, B and the total responses data comparison for the learners (L) in the second group (FR). With feedback (F) and with rule (R)
In the subjects of group III (fr) who perform the test without rule and without feedback (fr) there was a steady increase in learner’s average performance. The non-learners had, as expected, no start to finish difference. The percentage for the correct answers were 71% for learners and were less for non-learners, 45% for whole experiment, but for non-learners incorrect answers were 42.5 % and were less for learners 20.4 % see appendix 5 Table (5.5.3.).
Table (3.2.4.) shows that the learners and non-learners correct answers percentage for type A (38.3 & 23.2%) were more than type B (30.5% & 22.2%). Incorrect answers for both groups were learners and non-learners (8.8% & 20.9%) respectively for type A and were more for type B (15.9% & 21.8%).
The subjects of group IV (fR) performances after giving them full detailed information about the task and they performed it without feedback (WRNF). The non-learners had very good start in the first ten trials (81%) and then the number of the correct answers trials gradually decreased and they tried hard to catch up but they could not get the cut off point and their total average percentage was less than 60 %. The learners started with 65% and then the correct answers trials gradually increased and they get more than 70% in the last fifty trials and their average percentage for the correct answers was 73.9% and their incorrect answer percentage was 13.7%. See appendix 5 Table (5.5.4.).
Table (3.2.5.) shows that the learner’s correct and incorrect answer percentage for type A was (40.1 & 3.8%) the percentage was for type B (33.4% & 8.1%) respectively. The non-learners correct answers for both patterns A % B were (26.4% & 31.7%) respectively, and for incorrect answers percentage type A and type B were (16.7% & 13%) respectively. The original patterns were complimentary pattern, type A proved to be easily identified.
|
RESPONSES |
Learners (Lfr n= 8) |
Non-learners (nLfr n= 16) |
||||
|
TYPE % |
TYPE A |
TYPE B |
Total |
TYPE A |
TYPE B |
Total |
|
CORRECT |
38.6 |
31.5 |
70.1 |
23.2 |
22.2 |
45.4 |
|
INCORRECT |
8.8 |
11.8 |
20.6 |
20.8 |
21.8 |
42.6 |
|
NO RESPONSE |
3.9 |
5.5 |
9.3 |
5.9 |
6.1 |
12.0 |
Table (3.2.4.) shows type A, B and the total responses data comparison for the learners (L) and the non-learners (nL) in the third group (fr). Without feedback (f) and without rule (r)
|
RESPONSES |
Learners (LfR n= 6) |
Non-learners (nLFr n= 9) |
||||
|
TYPE % |
TYPE A |
TYPE B |
Total |
TYPE A |
TYPE B |
Total |
|
CORRECT |
40.2 |
33.4 |
73.6 |
26.4 |
31.3 |
57.7 |
|
INCORRECT |
4.6 |
9.2 |
13.8 |
16.7 |
14.1 |
30.8 |
|
NO RESPONSE |
4.3 |
8.3 |
12.6 |
6.2 |
5.3 |
11.5 |
Table (3.2.5.) shows type A, B and the total responses data comparison for the learners (L) and the non-learners (nL) in the fourth group (fr). Without feedback (f) and without rule (r ).
3.3. Decision Time Results:
3.3.1. All trials decision time:
Decision time (DT) was recorded by the pattern generating computer. The mean decision times were measured and compared for all trial answers in every group. The first fifty were compared to the last fifty trial answers. In the same way the correct trials answers were compared to the incorrect trials answers. The trials answers of type A were compared to the type B. Different statistical methods were used as Independent T-test for cross group, and Paired T-test for within group.
Were there statistical significant differences in the decision time between the learners and the non-learners?
Figure (3.3.1.) shows the answer of the previous question. The mean decision time data for learners were shorter compared to the non-learners in group I (Fr), group II (FR) were all learners. In Group III (fr) and IV (fR) the non-learners mean decision time was shorter than the learners were.
All the grand averaged trials answer decision time from table (3.3.1.) show that there was statistical significant difference (P
£ 0.01) between learners mean decision time (0.94sec) and non-learners mean decision time (1.12sec) in the first group (Fr). Group III (fr) non-learners (nLfr) mean decision time (1.01sec) was shorter than the learners (Lfr) mean decision time (1.27sec) and it was statistically significant (P£ 0.01). The learners (LfR) mean decision time (1.16sec) in the fourth group (fR) had a shorter than the non-learners (nLfR) mean decision time (1.47sec) and it was statistically significant (P£ 0.001).|
GROUP |
LEARNERS (L) |
NON-LEARNERS (nL) |
Differences |
|
Group I (Fr) |
0.94 ** |
1.12 |
0.18 |
|
Group III (fr) |
1.01 ** |
1.27 |
0.26 |
|
Group IV (fR) |
1.16 *** |
1.47 |
0.31 |
Table (3.3.1.) Learners and non-learners means of the mean decision time during all trial answers of the learning task. P value *
£ 0.05, ** £ 0.01, *** £ 0.001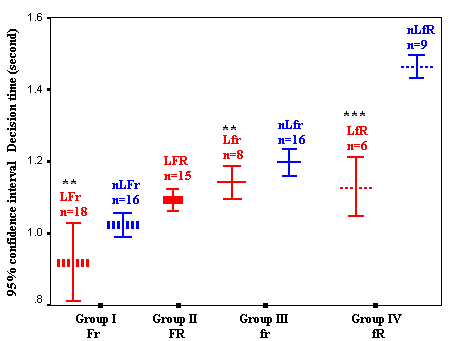
Figure (3.3.1.) shows an error bar chart shows the mean decision time for the learner’s (L) in red color and non-learners (nL) in blue color during a learning task. Y-axis represents subjects mean decision time, confidence interval (95%), and the standard errors. X-axis represents different group and experiments conditions. Thick line with feedback (F) thins line without feedback (f). Solid line with rule (R), interrupted line without rule (r). P value: *
£ 0.05, ** £ 0.01, *** £ 0.001.3.3.2. The first and last fifty:
The first and last fifty responses percentage were used to compare before and after learning data for the learning curve, but some subjects appeared to have learnt in the beginning, during the first fifty patterns, as shown in appendix 3.
Table (3.3.2.) representing the first fifty trials answers mean decision time for the learners and the non-learners in groups I, III, IV. There was a statistical significant difference (P<0.002), between the shorter mean decision time for the learners first fifty answers (0.97sec) as compared to the first fifty mean decision time for the non-learners (1.17sec) in the first group (Fr).
Group III (fr) there was a statistical significant difference (P£ 0.004), for the learners last fifty trials answers mean decision time (0.98sec) which was shorter in comparison with the last fifty mean decision time for the non-learners (1.18sec).
Group IV (fR) the non-learners had longer mean decision time (1.46sec) when compared to the learners means decision time (1.17sec) and it was highly statistically significant (P£ 0.001).
Table (3.3.3.) shows that there was a statistically significant difference (P£ 0.001), between the mean decision time (DT) which was shorter for learners in group one (Fr) last fifty trials answers (0.89sec) when compared with the last fifty mean decision time (1.13sec) for the non-learners (nLFr).
In group three (fr) there was highly statistically significant difference (P<0.001), between the longer mean decision time (1.23sec) for the non-learners first fifty answers as compared to the first fifty mean decision time for the learners (1.05sec).
Group Four (fR) we found that there was highly statistically significant differences (P<0.001) for the non-learners mean decision time (1.47sec) in comparison with the learners mean decision time (1.18sec).
|
GROUP |
LEARNERS (L) |
NON-LEARNERS (nL) |
Differences |
|
Group I (Fr) |
0.97 ** |
1.17 |
0.20 |
|
Group III (fr) |
1.05 *** |
1.23 |
0.18 |
|
Group IV (fR) |
1.18 *** |
1.47 |
0.29 |
Table (3.3.2.) Learners and non-learners means of the mean decision time during the first fifty trial answers of the learning task. P value *
£ 0.05, ** £ 0.01, *** £ 0.001
|
GROUP |
LEARNERS (L) |
NON-LEARNERS (nL) |
Differences |
|
Group I (Fr) |
0.89 *** |
1.13 |
0.24 |
|
Group III (fr) |
0.98 ** |
1.18 |
0.20 |
|
Group IV (fR) |
1.11 *** |
1.46 |
0.35 |
Table (3.3.3.) Learners and non-learners means of the mean decision time during the last fifty trial answers of the learning task. P value *
£ 0.05, ** £ 0.01, *** £ 0.0013.3.3. Correct versus incorrect answer decision time:
Table (3.3.4.) shows that there was a statistically significant difference in the first group (P£ 0.008) between the mean decision time, which was shorter for the learners correct answers trials (0.92sec), and the non-learners correct answer trials mean decision time (1.121sec).
Group III (fr) we found a statistically significant difference (P£ 0.04), for the non-learners shorter mean decision time correct answers trials (1.03sec), as compared to the incorrect answers trials mean decision time for the learners (1.18sec).
Group IV (fR) the non–learners have short decision time (1.47sec) when compared to the learners group decision time (1.16sec) and it is highly statistical-significant (P£ 0.001).
Table (3.3.5.) shows that there was a statistically significant difference (P£ 0.04), in the first group between the shorter mean decision time for the learners incorrect answers (0.98sec), as compared to the incorrect answers trials mean decision time for the non-learners (1.12sec).
In group three there was a statistically significant difference (P£ 0.01), between the shorter mean decision time for the non-learners incorrect answers trials (1.26sec) as compared to the incorrect answers trials mean decision time for the learners (1.00sec).
Group four we found that there was highly statistically significant differences (P<0.001) for the non-learners mean decision time (1.16sec) in comparison with the learners mean decision time (1.55sec) during the incorrect answer trials.
|
Group |
Learners (L) |
Non-learners (nL) |
Differences |
|
Group I (Fr) |
0.92 ** |
1.13 |
0.21 |
|
Group III (fr) |
1.03 * |
1.18 |
0.15 |
|
Group IV (fR) |
1.16 *** |
1.47 |
0.31 |
Table (3.3.4.) Learners and non-learners means of the mean decision time during the correct answer trials of the learning task. P value *
£ 0.05, ** £ 0.01, *** £ 0.001|
Group |
Learners (L) |
Non-learners (nL) |
Differences |
|
Group I (Fr) |
0.98 * |
1.12 |
0.14 |
|
Group III (fr) |
1.00 ** |
1.26 |
0.26 |
|
Group IV (fR) |
1.16 *** |
1.55 |
0.39 |
Table (3.3.5.) Learners and non-learners means of the mean decision time during the incorrect answer trials of the learning task. P value *
£ 0.05, ** £ 0.01, *** £ 0.001Both learners and non-learners took consistently longer to reach a decision time when the answer was incorrect than when correct.
3.3.4. Pattern type A versus type B decision time:
A difference in decision times according to whether pattern A or B was on the screen was not expected. Analysis showed that the decision times were longer for the non-learners than the learners when pattern A and B were considered separately.
Table (3.3.6.) shows that there was a statistically significant difference (P<0.01), between the mean decision time, which was shorter for the learner’s type A trials (0.93sec), and type A trials mean decision time for the non-learners (1.11sec) in group I (Fr).
Group III (fr) in comparison we found that there was highly statistically significant difference (P<0.001), for the learner’s type A trials mean decision time (1.00sec) where they have been faster than the non learner’s type A mean decision time (1.17sec).
Group IV (fR) the non–learners have a longer mean decision time (1.47sec) when compared to the learner’s mean decision time (1.18) and it was highly statisticall significant (p<0.001).
Table (3.3.7.) representing the decision time in both group’s learners and non-learners according to the pattern type (A or B). In group I (Fr) we found that there was a statistically significant difference (P<0.01), between the shorter mean decision time for learner’s type B trials (1.12sec) as compared to the type B trials mean decision time for the non-learners (0.95sec).
Group three there was no statistically significant difference (P<0.08), between the mean decision time for the non-learner’s image type B trials (1.02sec) as compared to the image type B trials answers mean decision time for the learners (1.03sec).
Group IV (fR) we found that there was highly statistically significant differences (P<0.001) for the non-learner’s type B trials mean decision time (1.46sec) in comparison with the learner’s mean decision time (1.15sec).
|
Group |
Learners (L) |
Non-learners (nL) |
|
Group I (Fr) |
0.93 ** |
1.11 |
|
Group III (fr) |
1.00 *** |
1.17 |
|
Group IV (fR) |
1.18 *** |
1.47 |
Table (3.3.6.) Learners and non-learners mean of the mean decision time during the image type A answer trials of the learning task. P value *
£ 0.05, ** £ 0.01, *** £ 0.001
|
Group |
Learners (L) |
Non-learners (nL) |
|
Group I (Fr) |
0.95 ** |
1.12 |
|
Group III (fr) |
1.03 |
1.02 |
|
Group IV (fR) |
1.15 *** |
1.46 |
Table (3.3.7.) Learners and non-learners means of the mean decision time during the image type B answer trials of the learning task. P value *
£ 0.05, ** £ 0.01, *** £ 0.001Were there any differences between the first fifty and last fifty trials in the learners and non-learners within every group?
Were there any differences between the correct and incorrect trial answers in the learners and non-learners within every group?
Were there any differences between the trial answers for the pattern type A and Type B in the learners and non-learners within every group?
To answer these three questions we have to look thoroughly through the following figures and tables.
All figures show the learners in red color and the non-learners in blue color. Thick line is for the group, which had feedback and the thin line for those who had not. Solid line for the group that had the rule (full task information) and the interrupted for those who did not.
The first fifty represented by the first bar is compared to the last fifty represented by the second bar from the left-hand side represents the mean decision times. The incorrect answers in third bar is compared to the correct answer trials in the fourth bar. The images of type "A" trials in the fifth bar is compared to the image type B trials in the last bar.
The plotted line represents the mean decision time with standard error for each condition. Confidence intervals of 95% or better are marked.
3.3.5. The learners decision time:
3.3.5.1. The first group (LFR n=18):
Figure (3.3.2.) shows an error bar chart representing the mean decision times, confidence intervals and standard errors for the experiment all conditions; the first fifty versus last fifty; the correct answers is compared to the incorrect answers; the image type A trial answers is compared to the image type B answers.
First row in table (3.3.8.) shows that there was a statistically significant difference (P<0.04) between the mean decision time for last fifty trials answer (0.89sec) and the first fifty the mean decision time (0.97sec) in the first group learners (LFr).
Table (3.3.9.) shows that there was a statistically significant differences (P<0.04) between the correct answers mean decision time and the longer incorrect answers mean decision time (0.92sec and 0.98sec) respectively in the first group learners (LFr).
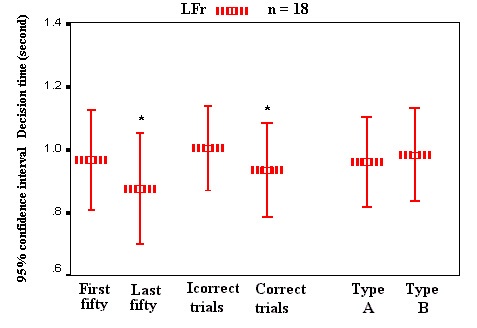
Figure 3.3.2. Error bar chart shows the mean decision time for the learners in red of the first group (LFr) during a learning task. Y-axis represents subjects mean decision time, confidence interval (95%), and the standard errors. X-axis represents different group and experiments conditions. Thick line with feedback (F), interrupted line without rule (r). P value: *
£ 0.05, ** £ 0.01, *** £ 0.001.Table (3.3.10.) shows that there was no statistical significant differences (P>0.8) between the image type A answers mean decision time (0.93sec) and the image type B answers mean decision time (0.95sec) in the first group learners (LFr).
3.3.5.2. The second group (LFR n=15):
Figure 3.3.3. Shows the error bar chart representing the mean decision times, confidence intervals and standard errors for the experiment all conditions. The first fifty versus last fifty. The correct answers is compared to incorrect answers. The image type A trial answers is compared to the image type B answers.
Table (3.3.8.) shows that there was a statistically significant difference (P<0.01) between the mean decision time for last fifty trials answers (1.03sec) and the first fifty the mean decision time (1.15sec) in the group II of learners (LFR).
Table (3.3.9.) shows that there was highly a statistically significant difference (P<0.001) between the correct answers mean decision time and the longer incorrect answers mean decision time in the group II of learners (LFR) (1.05sec and 1.2sec) respectively.
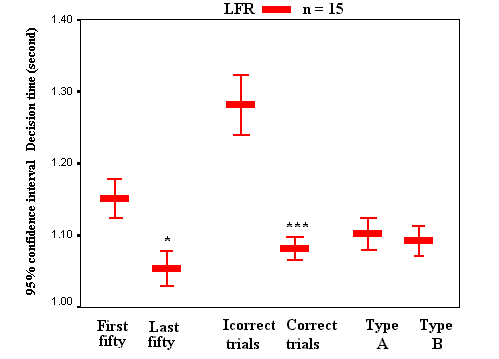
Figure (3.3.3.) shows an error bar chart shows the mean decision time for the learners in red of the second group (LFR) during a learning task. Y-axis represents subjects mean decision time in seconds, confidence interval (95%), and the standard errors. X-axis represents different group and experiments conditions. Thick line with feedback (F), Solid line without rule (R). P value: *
£ 0.05, ** £ 0.01, *** £ 0.001.Table (3.3.10.) shows that there were no statistically significant difference (P>0.1) between the type A trial answers mean decision time (1.1sec) and the type B trial answers mean decision time (1.07sec) in the learners of group II (LFR).
3.3.5.3. The third group (Lfr n=8):
Figure (3.3.4.) shows the error bar chart representing the mean decision times, confidence intervals and standard errors for the experiment all conditions. The first fifty is compared to the last fifty. The correct answer is compared to incorrect answers. The image type A trial answer is compared to the image type B answers.
Table (3.3.8.) shows that there was no statistically significant difference (P<0.05) between the mean decision time for last fifty trials answers (0.98sec) and the first fifty the mean decision time (1.05sec.
Table (3.3.9.) shows the comparison between the correct answers mean decision time and the longer incorrect answers mean decision time in the group of learners (1.00sec and 1.08sec) respectively, and was not statistically significant (P<0.05).
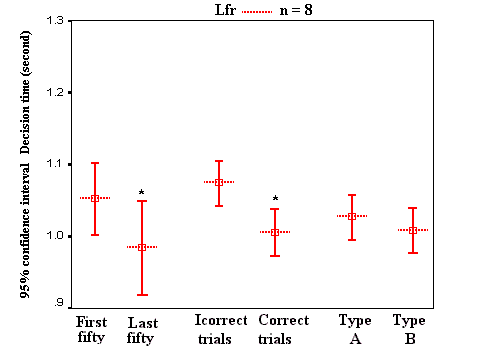
Figure (3.3.4.) shows an error bar chart shows the mean decision time for the learners in red of the third group (Lfr) during a learning task. Y-axis represents subjects mean decision time in second, confidence interval (95%), and the standard errors. X-axis represents different experiment conditions. Thin line with feedback (f), interrupted line without rule (r). P value: *
£ 0.05, ** £ 0.01, *** £ 0.001.Table (3.3.10.) shows that there were no statistically significant differences (P<0.2) between the trials answers mean decision time for type A (1.00sec) and the type B answer mean decision time (1.02sec) in the learners of group III (Lfr).
3.3.5.4. The fourth group (Lfr n=6):
Figure (3.3.5.) shows an error bar chart representing the mean decision times, confidence intervals and standard errors for the experiment all conditions; the first fifty is compared to the last fifty; the correct answers is compared to incorrect answers; the image type A trial answers is compared to the image type B answers.
Table (3.3.8.) shows that there is no statistically significant difference (P< 0.4) between the mean decision time for last fifty trials answers (1.11sec) and the first fifty the mean decision time (1.18sec) in the learners of group IV (LfR).
Table (3.3.9.) shows that there was a statistically significant difference (P< 0.04) between the correct answers mean decision time and the longer incorrect answers mean decision time in the learners of group IV (LfR), (1.06sec & 1.16sec) respectively.
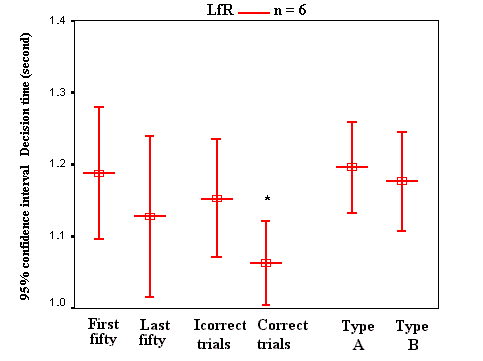
Figure (3.3.5.) shows an error bar chart shows the mean decision time for the learners in red of the fourth group (LfR) during a learning task. Y-axis represents subjects mean decision time in second, confidence interval (95%), and the standard errors. X-axis represents different experiment conditions. Thin line with feedback (f), solid line without rule (R). P value: *
£ 0.05, ** £ 0.01, *** £ 0.001.Table (3.3.10.) shows that there were no statistically significant difference (P<0.8) between the trial answer mean decision time for the type A (1.18sec) and the type B answer mean decision time (1.15sec) in the learners of group IV (LfR).
|
LEARNERS (L) |
First fifty |
Last fifty |
Differences |
|
Group I (LFr n=18) |
0.97 |
0.89 * |
0.12 |
|
Group II (LFR n=15 |
1.15 |
1.03 ** |
0.12 |
|
Group III (Lfr n=8) |
1.05 |
0.98 * |
0.07 |
|
Group IV (LfR n=6) |
1.18 |
1.11 |
0.07 |
Table (3.3.8.) Learners mean decision time of the first fifty and last fifty trial answers during a learning task. P value *
£ 0.05, ** £ 0.01, *** £ 0.001
|
LEARNERS (L) |
CORRECT |
INCORRECT |
Differences |
|
Group I (LFr n=18) |
0.92 * |
0.98 |
0.06 |
|
Group II (LFR n=15 |
1.05 *** |
1.28 |
0.23 |
|
Group III (Lfr n=8) |
1.00 * |
1.08 |
0.08 |
|
Group IV (LfR n=6) |
1.06 * |
1.16 |
0.10 |
Table (3.3.9.) Learners mean decision time of the correct and Incorrect Trials answers during a learning task. P value *
£ 0.05, ** £ 0.01, *** £ 0.001
|
LEARNERS (L) |
TYPE A |
TYPE B |
Differences |
|
Group I (LFr n=18) |
0.93 |
0.95 |
0.02 |
|
Group II (LFR n=15 |
1.10 |
1.07 |
0.03 |
|
Group III (Lfr n=8) |
1.00 |
1.02 |
0.02 |
|
Group IV (LfR n=6) |
1.18 |
1.15 |
0.03 |
Table (3.3.10.) Learners mean decision time of image type A and image type B trial answers during a learning task. P value *
£ 0.05, ** £ 0.01, *** £ 0.001
3.3.6. The non-learners decision time:
3.3.6.1. The first group (nLFr n=16):
Figure (3.3.6) shows an error bar chart that represents the mean decision times, confidence intervals (95%), and the standard errors during the different experiment conditions; the first fifty is compared to the last fifty; the correct answers is compared to the incorrect; the image type A trial answers is compared to the image type B answers.
Table (3.3.11.) shows that there was no statistically significant difference between (P>0.06) the first row non-learners last fifty and first fifty mean decision times (1.17sec & 1.13sec), respectively
Table (3.3.12.) shows the comparison between the correct answers trials mean decision time and the incorrect answers trials mean decision time for group one non-learners in the first row (1.13sec & 1.12sec) respectively and it was not statistically significant (P>0.9).
Table (3.3.13.) shows that there was no statistically significant difference (P>0.8) in the first row between the image type A answers trials mean decision time (1.11sec) and the image type B answers trials mean decision time in the non-learners group (1.12sec).
3.3.6.2. The third group non-learner (nLfr n=16):
An error bar chart that represent the result of the mean decision time, confidence intervals (95%), and the standard errors during the different experiment conditions; the first fifty is compared to the last fifty; the correct answer is compared to the incorrect; the image type A trial answer is compared to the image type B answers as shown in figure (3.3.7.).
Table (3.3.11.) shows that there was no statistically significant differences (P>0.09) for the second row non-learners between the last fifty and the shorter first fifty mean decision time (1.23sec & 1.18sec), respectively
Table (3.3.12.) shows the comparison between the correct answers trials mean decision time and the incorrect answers trials mean decision time for the non-learners in group one in the second row (1.18sec & 1.26sec), respectively and it was statistically significant (P>0.05).
Table (3.3.13.) there is no statistically significant difference (P>0.2) in the second row between the image type A trials answers mean decision time (1.17sec) and the nearly similar mean decision time (1.16sec) for type B answers in the non-learners group.
3.3.6.3. The fourth group (nLfr n=9):
Figure (3.3.8.) shows comparison of an error bar chart that summarizes the mean decision times, confidence intervals (95%), and the standard errors during different experiment conditions; between the first fifty and the last fifty; the correct answers and the incorrect. The image type A trial answers and the image type B answers.
Table (3.3.11.) shows that there was no statistically significant difference (P>0.5) for the third row non-learners between the last fifty trials answers mean decision time (1.47sec) and first fifty trials answers mean decision time (1.46sec).
Table (3.3.12.) shows the comparison between the correct answers trials mean decision time and the incorrect answers trials mean decision time for the non-learners in group IV in the third row (1.47sec & 1.55sec) respectively and it was statistically significant (P>0.05).
Table (3.3.13.) shows that there was no statistically significant difference (P>0.4) in the third row between the Image type A trials answers mean decision time (1.47sec) and the image type B trial answers mean decision time (1.46sec) in the non-learners group.
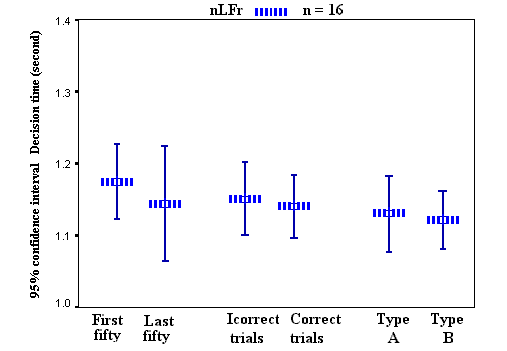
Figure (3.3.6.) an error bar chart shows the mean decision time for the non-learners in red of the first group (nLFr) during a learning task. Y-axis represents subjects mean decision time in seconds, confidence interval (95%), and the standard errors. X-axis represents different experiment conditions. Thick line with feedback (F), interrupted line without rule (r). P value: *
£ 0.05, ** £ 0.01, *** £ 0.001.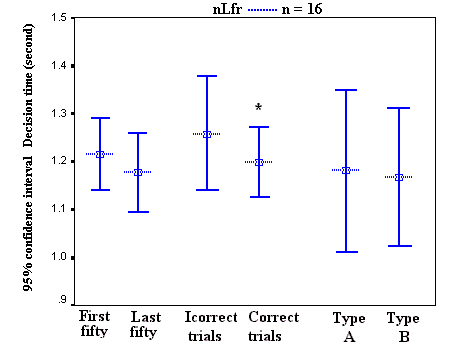
Figure (3.3.7.) an error bar chart shows the mean decision time for the non-learners in red of the third group (nLfR) during a learning task. Y-axis represents subjects mean decision time in second, confidence interval (95%), and the standard errors. X-axis represents different experiment conditions. Thin line with feedback (f), interrupted line without rule (r). P value: *
£ 0.05, ** £ 0.01, *** £ 0.001.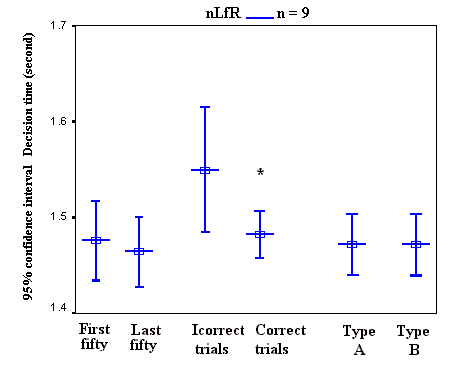
Figure (3.3.8.) an error bar chart shows the mean decision time for the non-learners in red of the fourth group (nLfR) during a learning task. Y-axis represents subjects mean decision time in second, confidence interval (95%), and the standard errors. X-axis represents different experiment conditions. Thin line with feedback (f), solid line without rule (R). P value: *
£ 0.05, ** £ 0.01, *** £ 0.001.
|
Non-Learners (nL) |
First fifty |
Last fifty |
Differences |
|
Group I (nLFr n=16) |
1.17 |
1.13 |
0.04 |
|
Group III (nLfr n=9) |
1.23 |
1.18 |
0.04 |
|
Group IV (nLfR n=16) |
1.47 |
1.46 |
0.01 |
Table (3.3.11.) Non-learners mean decision time of the first fifty and last fifty trial answers during a learning task. P value *
£ 0.05, ** £ 0.01, *** £ 0.001
|
Non-Learners (nL) |
CORRECT |
INCORRECT |
DIFFERENCES |
|
Group I (nLFr n=16) |
1.13 |
1.12 |
0.01 |
|
Group III (nLfr n=9) |
1.18 * |
1.26 |
0.08 |
|
Group IV (nLfR n=16) |
1.47 * |
1.55 |
0.08 |
Table (3.3.12.) non-learners mean decision time of the correct trial answers and incorrect trial answers during a learning task. P value *
£ 0.05, ** £ 0.01, *** £ 0.001
|
Non-Learners (nL) |
TYPE A |
TYPE B |
DIFFERENCES |
|
Group I (nLFr n=16) |
1.11 |
1.12 |
0.01 |
|
Group III (nLfr n=9) |
1.17 |
1.16 |
0.01 |
|
Group IV (nLfR n=16) |
1.47 |
1.46 |
0.01 |
Table (3.3.13.) Non-learners mean decision time during image type A and image type B trials during a learning task. P value *
£ 0.05, ** £ 0.01, *** £ 0.001
3.3.7. Conclusion to this section: