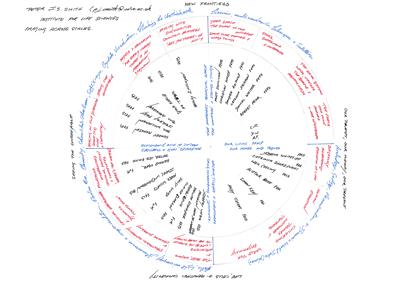
Professor Peter Smith, Director of the Institute for Life Sciences at the University of Southampton, came to us with a hand-drawn diagram (see left, click to expand) that showed the circularity of complex imaging and imaging techniques (‘seeing the unseeable’) across scales ranging from individual cellular structures to planetary and solar systems. The aim was to create a digital iteration of Smith’s diagram, an object with many overlapping and interconnecting sections. These very particular spatiotemporal instances would need to be maintained.
A looping film format was used to recreate the endless cycle of the diagram, moving information from the analogue original to a time-based digital model. The challenge here was to move this diagram into a digital space without losing the essence of the original; and even to enhance aspects of communication, as reading would now take place in a controlled way, in terms of the order of elements and the time spent with them inside the film setting. Inevitably, with translation from such a rich analogue object comes a certain loss, of texture, of substance.
We can say that both iterations of imaging across scales have no beginnings or ends and they can be approached at any point in the circle of events (although perhaps our natural inclination is to start with the original diagram at the top of the page, which is only demarcated at all because of where Smith has written his name and the title of the piece). The ‘time-based media’ of looping video is used here to represent the circular model of the diagram, but it must be emphasised that the original has a time of its own, a reading time that that draws on our temporal experiences of looking at clocks and even negotiating the endless movement of the earth around the sun and the circularity of night and day.
The first task was to transcribe the words contained in the circle to a hierarchical, colour-coded list; to break the diagram into units; in effect, to archive the components, describing their place on the diagram using the clock position, or clock bearing (two o'clock, six o'clock etc). This a relative bearing, based on the position of Smith's name, and not a true bearing, as the diagram can be read any way up, starting at any point. The transcription was designed to meaningfully map the words, in preparation for a cut-and-paste incorporation into the film programme, but the act of copying provided a certain acknowledgement and understanding of Peter Smith’s words, allowing them to be known in a way that simply reading them would not. The language can be appreciated in a poetic as well as a scientific way, including phrases such as ‘beautiful complexity’ and ‘weird things’, and the questions ‘Are you there or not?’ and ‘Where’s the water?’ These are not the poetics of an institutionally cultivated language but a genuinely creative linguistic practice that is tied to a deep and broad thinking and that is perhaps more common across the disciplines than it is believed to be.
A timeline was drawn up and sent to Professor Smith so that he could check that the transcription of his hand was correct, and, more critically, that the timing, grouping and overlapping of elements were as he intended them to be. Next, Smith’s words and phrases were taken into the film editing software, where the hierarchies and the contextual relationships of the units of information could be manipulated spatiotemporally until they replicated those contained in the diagram. These relationships were signified in the film by the use of typographic styles, font sizes and colour, and by adding carefully and variously timed cross-dissolves, overlaps, fades and gaps.
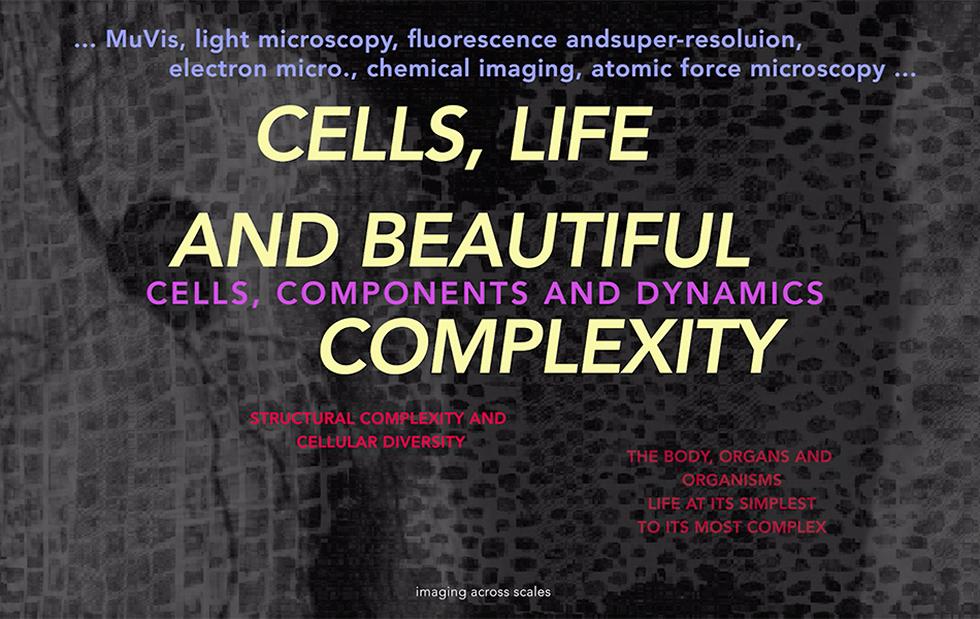
Although the words themselves are key here (as they are in the original), it was felt that a subtle element of imaging should be included in order to counteract the dryness of the digital form (when compared to the richness of the hand in the original, at any rate) and to maintain the interest and the focus of the audience. The images used came from a variety of sources: electron microscope images of viruses from Franklin Luzia de Nobrega; scans of large format transparencies from a Photographic Atlas of the Northern sky (unwanted artefacts the Physics Department); stills from the film Hybrid Bodies, courtesy of artist Andrew Carnie; and Robert Hooke’s illustration of cork cells under a microcope from 1665 (said to be the origin of the word ‘cell’ because Hooke thought the drawing resembled prison cells).
This is an ongoing project and it is possible that the exploration of Professor Smith's diagram could be continued in a materially rich analogue way; think of zoetropes, phenakistiscopes (animation wheels) or those old plastic Viewmasters, for example. Moreover, this diagram, in whatever form it takes, will provide a springboard to a closer look at the uses of images—and their ability to confound established ideas about scale—across the Life Sciences and the wider University.