To investigate the research questions posed in each section of this site, we’ll be using SPSS, an IBM computer software package specifically designed for use in the social sciences. SPSS allows quick and easy data analysis and is fairly simple to use. In many ways, it’s very similar to using Microsoft Excel, although for quantitative analysis it has many advantages over Excel.
You may already be familiar with SPSS, and even if you haven’t used it much, you will get lots of experience working with the program as you explore the datasets analyzed on this site. However, if you are unfamiliar with how SPSS works, the guide below will provide you with information about the basic functions of SPSS and how you can use it to your advantage in analysis. In the examples we use version 21 of the program.
Opening SPSS
When you open the SPSS program, a dialogue box appears with a choice of options. On the left side of this dialogue box, you will see the option to open an existing data source. The text box underneath Open an existing data source allows you to select a previously opened SPSS data file (provided you’ve used this program before). If you want to open a file that isn’t listed (or if you have never used SPSS before and therefore have no previously viewed files), click on More Files, which will open up an Explorer window that will allow you to browse your own files for the one you want.
If you have downloaded the datasets we discuss in our sections here, you can open SPSS simply by opening the data files included in the data packages. Instructions on how to access and download the datasets we use can be found on the Data Access page here.
You can also create a new data file by clicking Cancel to take you out of the dialogue window or by selecting the Type in data option on the right. Clicking on this option and then clicking OK will open a blank Data Editor window. If you are familiar with Microsoft Excel, you will notice that this window looks a lot like an Excel spreadsheet, but here there are only two worksheets.
One of the worksheets is Variable View, which is used to define the variables that are present in the data. If you find yourself with data to enter into SPSS, the Variable View window is where you can name, label, and assign values to the variables in your data. The other worksheet is the Data View window, which can be used to enter, edit, and modify the data in each individual case. For example, if you were creating a data file for survey data, you would use Variable View to define all your variables (i.e. age, sex, socioeconomic status, level of education), and Data View to enter the actual data, the individual survey participant responses (i.e. Respondent 1 is 38, male, and middle-class, with a Bachelor's degree).
When variables have been added to the dataset, Variable View looks like the photo on the right.
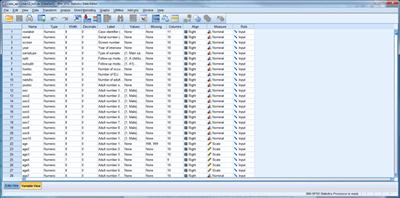
You can see that variables have been given names, labels, values, and have been defined by type of measurement. All of this information will be crucial to running analyses on the data in this data file.
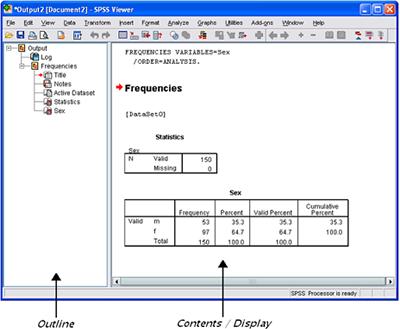
The Data Editor window is the main window used by SPSS, and closing this window will close SPSS. However, SPSS has another window called the Output Viewer, which is equally important. The Output Viewer is the window that displays the results of any statistical analyses you perform, including any charts or graphs you might ask SPSS to create. SPSS calls these results “output.”
The left pane of the Output Viewer is called the Outline. This contains a list of all the results you have produced. The outline pane provides a table of contents for all your output in a session. You can use the outline pane to navigate through your output and control the output display. The right pane is called the Contents (or Display) and contains the results themselves. These results can be statistical tables, as shown below, but can also be graphs and text.
You can edit, save, or print your results from the Output Viewer, or copy them from this window and use them in other documents.
SPSS Menus and toolbars
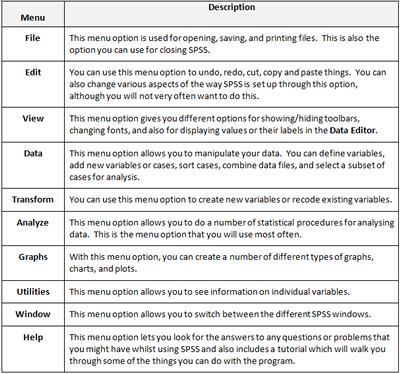
At the top of both the Data Editor and Output Viewer windows, you will see a menu bar with a number of options. The table to the right briefly describes how each menu selection can be used.
As with software packages like Microsoft Word and Excel, immediately below the SPSS menu bar in the Data Editor, there is a toolbar that contains a number of buttons which act as short-cuts for frequently used menu options.
To find out what a particular button does, you can hold the mouse pointer over a button for a moment and a box will appear with a description of the button.
The Output Viewer in SPSS has its own toolbar which has some extra buttons. Once again, you can hold the mouse pointer over each button to find out what each one does.
Getting Help
There are various ways of getting help within SPSS when you get stuck. You can:
- Select Help | Topics. This is very useful and gives information about how to carry out particular tasks. If you are not sure how to do a certain task, this is the best place to seek further help.
- Select Help | Case Studies. This option provides hands-on examples of how to create various types of statistical analyses and how to interpret the results.
- Select Help | Statistics Coach. This is designed to assist in data analysis by leading you through a series of questions about your data and what you want to do with it.
Learning More
As you move through the statistical analyses provided in each section, you will gain lots of valuable experience working with SPSS. You’ll run many different kinds of statistical tests, building graphs and interpreting your results as you go. You’ll learn short cuts to make using the program easier and will begin to understand how to use the program to your advantage. In addition, hopefully you’ll become confident enough in SPSS to do some explorations on your own, because often, spending some time with experimenting with the program is the best way to learn.