Is there a statistically significant relationship between educational attainment and awareness of neighbourhood policing?
A chi-square test is a statistical test used to compare observed results with expected results. The purpose of this test is to determine if a difference between observed data and expected data is due to chance, or if it is due to a relationship between the variables you are studying. Therefore, a chi-square test is an excellent choice to help us better understand and interpret the relationship between our two categorical variables.
To perform a chi-square, select Analyze, Descriptive Statistics, and then Crosstabs.
Find neighpol1 in the variable list on the left, and move it to the Row(s) box. Find educat3 in the variable list on the left, and move it to the Column(s) box.
Click Statistics, and select Chi-square.
Click Continue and then OK to run the analysis.
Your output should look like the one on the right.
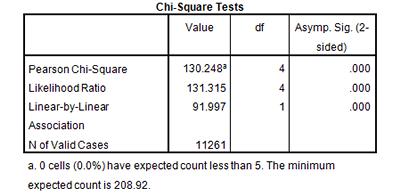
Take a look at the column on the far right of this output table. It is the Asymptotic Significance, or p-value, of the chi-square we’ve just run in SPSS. In all tests of significance, if p < 0.05, we can say that there is a statistically significant relationship between the two variables. The p-value in our chi-square output is p = 0.000. This means that the relationship between education level and awareness of neighbourhood policing is significant.
It’s worth mentioning that this test, like all tests of significance, only illuminates that there is a relationship and that that relationship has statistical significance (meaning, it is not due to chance). Running a chi-square test cannot tell you anything about a causal relationship between education and neighbourhood policing awareness. The test does not even inform about the direction of any relationship - it just tells you there is a relationship. We need to run further tests to tell us about this in more detail.
Let’s run a few more chi-squared tests to see if there are other categorical explanatory variables which may have significant relationships with neighpol1. We can look at religion (relig2a), employment (remploy), and health status (health2).
Before we use any of those three explanatory variables, we should check their frequencies to make sure the data is ready for bivariate analysis. (You can refer back to the univariate analysis pages in this section to help you run the frequency checks.) When you are satisfied that these variables are acceptable for further analysis, try running chi-square tests with each of these and neighpol1.
Which explanatory variables have statistically significant associations with respondent awareness of neighbourhood policing?
What conclusions can we draw from these analyses?
Summary
Using a chi-square test, you’ve just determined that there is, in fact, a statistically significant relationship between our two categorical variables, neighpol1 and educat3. Remember, however, that you are simple able to say now that survey respondent education level has a relationship with neighbourhood policing awareness. You cannot say that education level necessarily causes awareness of neighbourhood policing.