How many cases are there in each s2q10 category?
Before beginning any form of statistical analyses on any variables, it’s important to run frequency checks on the data contained in those variables. This is important irrespective of what type of variable you are interested in – categorical or continuous. These frequency reviews are quick and easy to do and they are enormously helpful in making sure that the variable’s data make sense and are without errors.
Frequency tabulations allow you to see how many individuals (or cases) fall into each category of the variables you are interested in. In addition, they also let you check for inconsistencies in the information entered into your variables. After you calculate frequencies, you could find that you have a lot of missing data or that missing data has been entered into the variable with numeric codes like “8” or “9,” which serve as place holders in variables when information doesn’t exist for certain individuals. This missing data could create problems in your analyses, so it’s best to search it out before you begin running tests.
To check the frequencies of the data in s2q10, simply click on Analyze, Descriptive Statistics, and Frequencies. Find s2q10 in the variable list on the left side of the Frequencies dialogue box and move it to the Variable(s) text box on the right. You can easily search for variable names in dialogue boxes by right-clicking on the list of variables and selecting Display Variable Names and Sort Alphabetically. (This is a trick you can use in SPSS all the time – it makes finding variables in large datasets much easier.)
When s2q10 is in the Variable(s) text box, click OK.
Your output table should look like the table on the right.
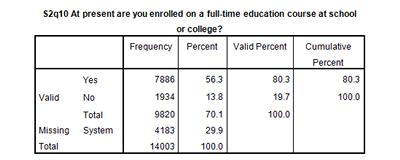
Occasionally, when survey data is collected, questionnaires are returned without answers to various questions. Sometimes, this missing data can be given a labelled category within the variable, and can cause problems in data analysis. (This is why we are checking our variables before analysing them.) Other times, the missing data is coded as System Missing data, which is recognized by SPSS as missing and is therefore not used in analysis. Luckily for us, the missing data in our variable s2q10 is coded as System Missing, so it won’t impact our analyses.
From the frequency table above, we can conclude that the data in s2q10 is ready for use, and now we can feel comfortable using this variable in bivariate and multivariate statistical analysis.
First, though, let’s explore some ways to represent the information in s2q10 graphically. The next page will outline some of the ways to build graphs illustrating the data in s2q10.
Summary
In this section you have studied the variable related to your research question – enrolment in full time education – and investigated if there was missing data. You discovered that the missing data in s2q10 has already been coded as missing in SPSS and therefore, it won’t cause issues in further analyses. Now, you can move on to representing the data in s2q10 in graphs.
Note: as we are making changes to a dataset we’ll continue using for the rest of this section, please make sure to save your changes before you close down SPSS. This will save you having to repeat sections you’ve already completed.