Houses in hurricane strike zones are built back bigger

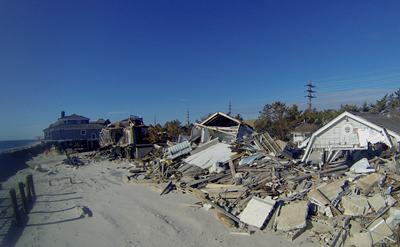
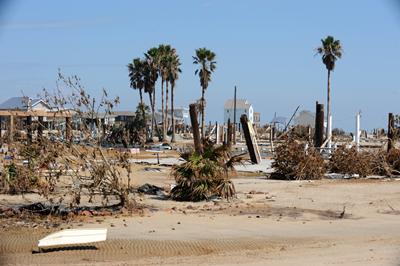
A study of hurricane-hit areas of the United States has revealed a trend of larger homes being built to replace smaller ones in the years following a storm.
The research, led by the University of Southampton (UK) and published in the journal Nature Sustainability, shows that the sizes of new homes constructed after a hurricane often dwarf the sizes of those lost.
Lead researcher Dr Eli Lazarus, of the School of Geography and Environmental Science at the University of Southampton, says: “Our findings highlight a ‘building back bigger’ trend in zones known to be prone to damage from extreme wind conditions and storm surge flooding. This practice creates an intensification of coastal risk – through increased, high-value property being exposed to major damage or destruction.”
A team of scientists from the UK and US measured changes in residential-building footprints at five locations on the US Atlantic and Gulf Coasts which have collectively suffered the effects of six hurricane systems between 2003 and 2012. They compared satellite imagery from before the major storms hit with corresponding imagery from 2017.
.jpg_SIA_JPG_fit_to_width_INLINE.jpg)
The areas examined were Mantoloking (New Jersey), Hatteras and Frisco (North Carolina), Santa Rosa Island (Florida), Dauphin Island (Alabama) and Bolivar (Texas). Each of the locations are developed coastal barriers (landforms which protect against the sea) in designated flood-hazard areas, featuring mainly single family residential buildings.
The research, which also involved Coastal Carolina University, United States Geological Survey, University of North Carolina and Cardiff University, showed an overall pattern of larger homes replacing smaller ones across all five coastal locations.
Among buildings which changed area size (pre and post storm) the average house footprint increased between 19 per cent (Hatteras) and 49 per cent (Santa Rosa Island). New homes constructed post-hurricane strikes (but not as direct replacements for existing buildings) exceeded the mean footprints of other pre-storm buildings in the locality by between 14 per cent (Mantoloking) and 55 per cent (Santa Rosa Island).

Houses in the US are getting bigger, in general. However, the increases shown in this study are much greater than the average increase nationally, and are happening despite policy measures intended to curb them.
Dr Lazarus comments: “The crippling effects of disasters on vulnerable communities can leave them open to – and perhaps ultimately pushed out by – speculative real-estate markets with investors who buy up ruined parcels of land to make gains in any subsequent recovery. The building of larger homes, in-turn, puts a greater strain on the funding of subsidised insurance for properties in at risk areas.”
The team suggests that the ‘build back bigger’ trend isn’t just limited to hurricane strike zones in the US, and is investigating long-term redevelopment patterns in other places subject to different types of disasters.
Related Staff Member
Notes for editors
- The researchers used publicly available imagery of requisite resolution and an appropriate capture date, spanning a full timeframe from before the last major hurricane strike at each location up to the most recent available imagery (2017). Pre-storm and 2017 imagery for Mantoloking, Santa Rosa Island, Dauphin Island and the Bolivar peninsula was obtained from Google Earth. Pre-storm imagery (2002) for Hatteras Village and Frisco (combined as ‘Hatteras’) was obtained from the NC OneMap GeoSpatial Portal. FEMA Flood Risk Zone designations are available through the agency’s Map Service Center.
- Building footprints were digitised manually and their areas were calculated using GIS software. The team digitised the roofed footprint of every residential building in the first three rows from the ‘ocean-side’ shorefront.
.jpg_SIA_JPG_fit_to_width_SQUARE.jpg)