Does worry about physical violence influence confidence in the police?
We’ve just used a two-sample t test to compare differences in means across two categories in binary variables. Now suppose we’d like to see if there are significant differences in mean police confidence scores based on worry about being physically attacked by strangers. For our independent variable, we’ll select wattack, which has five categories. If you want to compare the significance of differences in mean score across more than two categories of an independent variable, you need to use an Analysis of Variance, or ANOVA. An ANOVA works just like a t test, in that it analyses the significance of differences in means between categories in a variable with regards to sample variation. However, ANOVA tests are used when variables have more than two categories. Because we are curious about the impact one independent variable with several categories has on our dependent variable, we’ll be running a one-way ANOVA. If we were looking into the influence of two independent variables with several categories on a dependent variable, we would use a two-way ANOVA.
Before we begin, we should run frequency analysis on wattack to see what condition this variable is in (i.e. look for missing data and so on). Click on Analyze, Descriptive Statistics, and then Frequencies. Move wattack over to the Variable(s) text box and then click OK.
Your output should look like the tables on the right.
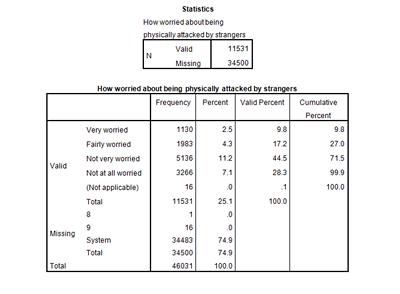
The first thing to notice is that we have 34,500 missing cases in this frequency table. Why is this? Remember that the CSEW is a survey compromised of questions asked of all participants and questions only asked of 25% of the participants. The second half of the CSEW questionnaire is split into four distinct parts, Modules A-D, with survey respondents only participating in one of the four modules. The variable wattack happens to be a question that was only asked to Module C participants, meaning the 75% of the survey sample did not answer this question. Despite this, it is still perfectly acceptable to use this independent variable when analysing policeconf1, because every survey respondent answered the survey questions regarding police confidence. In running this ANOVA, SPSS will only use the policeconf1 scores of CSEW respondents who participated in Module C.
In addition to the vast number of missing cases, we can also see in the frequency table above that there are a total of 17 cases coded as “8” or “9” in the variable. These are missing value codes, and are essentially used as placeholders for cases (or individuals) in which the answer to wattack was missing or unavailable. While these missing value codes are helpful in that they tell us what happened with these results, if we allow them to remain in the variable while we do analyses, we may end up with strange results. Therefore, before we run our ANOVA, we’ll need to recode these values of Missing in the variable, which will tell SPSS to exclude them from the ANOVA.
Luckily, this is very easy to do.
Find Variable View on the Data Editor window of SPSS. Click to highlight any cell under Name, the first column in Variable View. When a cell is highlighted, hit Ctrl + F. You should now see a dialogue box called Find and Replace - Variable View.
This box will help you locate wattack (or any other variable you’d like to find) quickly and easily. Just type wattack into the text box and click Find Next. SPSS will find wattack in the list of variables and bring it up for you.
Once you’ve found wattack, follow its row over to the Missing column and click to open the Missing Value dialogue box. Here, under Discrete Missing Values, enter in “8” and “9,” the missing value codes we found in the frequency table. Click OK.
The values 8 and 9 are now coded as missing in wattack and will not be used in our analyses.
When you’ve recoded the missing values in wattack, go to Analyze, Compare Means, and then One-Way ANOVA.
Enter policeconf1 in the Dependent List box and wattack in the Factor box. Click OK.
You should get an output like the one on the right.
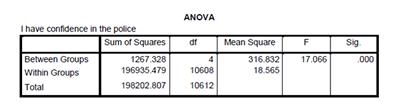
Because an ANOVA test works like a t test, we are again looking for a p-value of less than 0.05 in order to say that there is a statistically significant difference in the mean police confidence scores for varying degrees of worry about violence. In the table above, we can see that the significance level for this ANOVA is 0.000, well below the 0.05 threshold. This means that there the differences in the police confidence means between people who are very worried, fairly worried, not very worried, and not worried at all are statistically significant.
Summary
You’ve just run a One-Way ANOVA to determine that there were statistically significant differences in mean police confidence score between the categories of wattack. Next, suppose we wanted to find out exactly what the differences in mean were between all the categories of wattack. To answer this question, we’ll use a Post-Hoc Test.
Note: as we are making changes to a dataset we’ll continue using for the rest of this section, please make sure to save your changes before you close down SPSS. This will save you having to repeat sections you’ve already completed.