We’ve seen what the mean police confidence scores are for men and women in our survey sample. What are the potential police confidence mean scores for men and women in the entire population?
Another way to look at our measure of police confidence is to calculate confidence intervals. Our dataset, while quite comprehensive, only includes information about our sample,the 42,604 people who answered questions regarding their confidence in the police. We can calculate the means of variable values in our dataset, but we cannot be one hundred percent certain that the CSEW sample is representative of the true means across the entire population of England and Wales. We can, however, calculate a range of values within which the mean across the entire population is likely to fall. This range of values is called a confidence interval. It is possible to calculate a 95% confidence interval and a 99% confidence interval. These intervals are simply a way of giving a range of values that we are fairly (either 95% or 99%) confident includes the true population mean.
A 99% confidence interval will allow you to be more confident that the true value in the population is represented in the interval. However, it gives a wider interval than a 95% confidence interval. For most analyses, it is acceptable to use a 95% confidence interval to extend your results to the general population.
So, let’s begin by calculating a 95% confidence interval for the mean level of confidence in the police.
Select Analyze, Descriptive Statistics, and then Explore.
Move policeconf1 to the Dependent List box and then click OK.
Your output table should look like the one on the right.
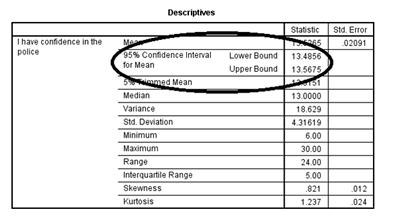
You can see in the table above that the Lower Bound of our 95% Confidence Interval is 13.4856 and the Upper Bound is 13.5675. We can interpret these results by saying that we are 95% confident the mean score for confidence in the police for all people in England and Wales will fall between 13.4856 and 13.5675. This is a simple interpretation of the interval – there are more nuances to the actual interpretation – but this will be adequate for now.
Now we can calculate a 99% confidence interval for mean confidence in the police.
Select Analyze, Descriptive Statistics, and then Explore.
Our variable policeconf1 should still be in the Dependent List box. Click on the Statistics tab on the upper right. In the dialogue box that opens, make sure Descriptives is marked and change the Confidence Interval for Mean from 95% to 99%.
Your output should look like the table on the right.
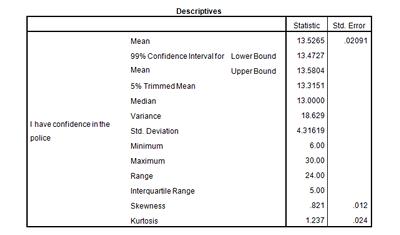
What is the 99% confidence interval for mean confidence in the police?
How would you interpret this confidence interval?
Summary
You’ve just calculated 95% and 99% confidence intervals using the data in our continuous variable, policeconf1. Confidence intervals allow us to generalize our findings from the samples from which our data was taken to the population from which our survey sample was drawn. This ability to generalize one’s findings is often very helpful in social science research.