Are the mean police confidence scores different for men and women?
We mentioned above that one easy way of seeing if there is a difference in police confidence between different groups of people is to calculate and compare the mean values of confidence in the police in each group you are investigating. Let’s say we are interested in discovering whether men and women have different levels of police confidence. We can use the Compare Means command to determine if sex has any bearing on police confidence. (We could obviously ask many questions like this – which you can do by yourself after we've run this first mean comparison together.)
Before we run any tests on the variable sex, we should use the Frequencies functions to see if there are any missing values, as these could upset our analyses.
Are there any missing values in the variable sex? Do we need to adjust this variable at all? If you are unsure about how to identify and change missing data, then look back at here.
Select Analyze, Compare Means, and then Means.
Move policeconf1 to the Dependent List box and sex to the Independent List box. Click OK.
Your Output window should look like the one on the right.
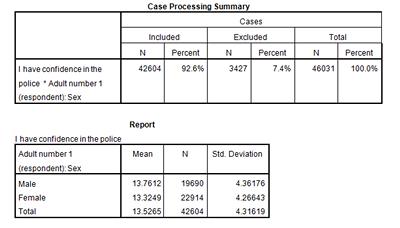
Here, we’re given the total number of survey respondents included in the police confidence variable we’ve created, the percentage of the total survey represented by the police confidence variable, the mean police confidence scores for men and women, the standard deviations of those means, and the number of respondents in each category.
What do you notice about the mean police confidence scores for men and women?
What does a lower score mean in our police confidence variable?
Is this mean difference what you might expect?
Summary
You have calculated the mean confidence for both males and females and interpreted the results. This is done so that you know the potential relationships within the data. Now, try to use the mean comparison method listed above to calculate the mean difference in police confidence scores for survey participants who answered theftd_r, a categorical variable cataloguing the number of thefts from dwellings participants experienced in a calendar year.
You can go on to use a t test to test the statistical significance of the difference in means for any explanatory (or independent) variables that are categorical with two categories.