The ANOVA we have just calculated tells us there is a difference in the mean police confidence levels depending on whether or not a survey respondent is worried about an attack. However, we don’t yet know what these differences are. Let’s say now you want to see how all the categories in wattack are different from each other. You can run a post-hoc test in addition to the ANOVA to produce comparisons between all the categories in your model.
Go back to Analyze, Compare Means, and then One-Way ANOVA. The information from our previous ANOVA should still be there. Click on Post Hoc on the right side of the dialogue box and select LSD (or Least Square Difference) under the Equal Variances Assumed header. This just defines what type of post-hoc comparison we’re running. There are many different types we could use, but the LSD is a standard one. Click Continue, and then OK in the original dialogue box.
You should have an output table like the one on the right.
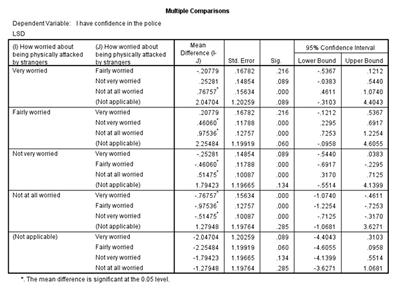
If you look at the first row of the post-hoc Multiple Comparisons table, you can see that the category “Very worried” has been compared to all the other categories in wattack. Let’s consider the mean comparison between “Very worried” and “Fairly worried.” In the Mean Difference column of this table, you can see that the mean difference in police confidence score between “Very worried” and “Fairly worried” is -0.20779. This can be interpreted as meaning that the mean police confidence score reported by people who were “Fairly worried” is, on average, 0.20779 points less than the mean police confidence score reported by people who were “Very worried.” Remembering that a lower score on the police confidence scale actually means higher confidence in the police, we can say that on average, respondents who were “Fairly worried” about physical violence have more confidence in the police than respondents who were “Very worried.”
Take a look at the comparison between “Fairly worried” and the rest of the categories in wattack. What is the mean difference between “Fairly worried” and “Not worried at all”? How would you interpret this?
Run another one-way ANOVA using policeconf1 as the dependent variable and homealon, a measure of feelings of safety while home alone at night, as the independent variable. Remember to check if homealon has any missing data values, and if so, make sure to recode them before running your ANOVA. Is there a statistically significant difference in mean police confidence scores in homealon?
Summary
Using a Post-Hoc Test, you’ve just calculated the mean differences in police confidence score between all the categories of wattack. This allows you to have a better understanding of the relationship wattack has with our dependent variable policeconf1, and also illuminates trends in police confidence score for different levels of worry about physical violence.