Patricia Goggin1,2, Richard OC Oreffo3, Philipp Schneider1
1 Bioengineering Science Research Group, Faculty of Engineering and Physical Sciences, University of Southampton, Southampton, UK
2 Biomedical Imaging Unit, University of Southampton, Southampton, UK
3 Bone and Joint Research Group, Centre for Human Development, Stem Cells and Regeneration, Faculty of Medicine, University of Southampton, Southampton, UK
Background
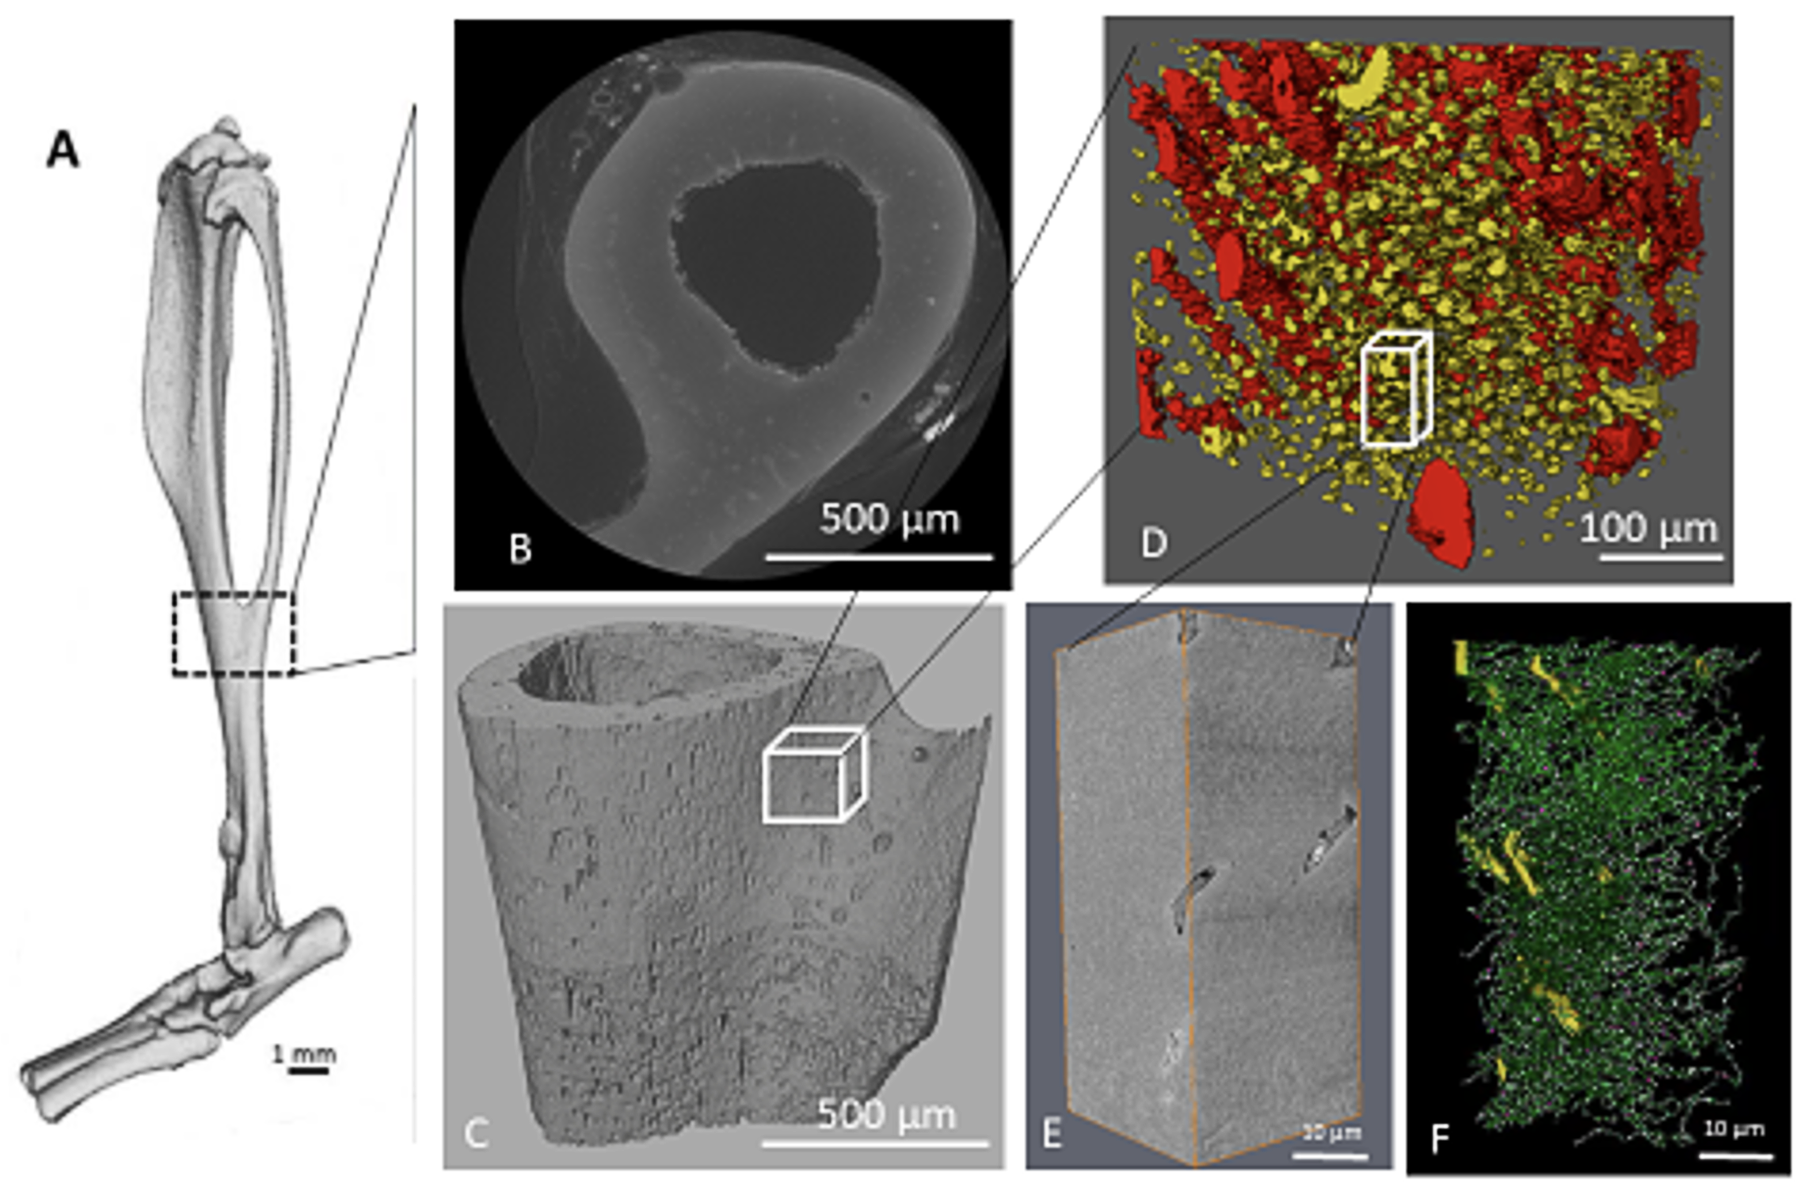
Osteocytes form a network of cells within the mineralised bone matrix. In order to image this cell network and the surrounding matrix at high spatial resolutions and in 3D, we have developed a correlative imaging framework (Figure). Combining X-ray computed tomography (µCT) & serial block-face scanning electron microscopy (SBF SEM) facilitates imaging and analysis of relatively large volumes of interest and delivers high-resolution quantitative information on the cellular hallmarks of bone anatomy and pathology in 3D. This workflow will also provide data for in silico modelling of bone mechanobiology in health, ageing and in bone diseases including osteoporosis.
Role of Computed Tomography
For this project, we used the Zeiss Xradia Versa 510 system at µ-VIS X-ray Imaging Centre to scan decalcified and heavy metal-stained bone tissue at a voxel size of 1.5 µm to investigate the osteocyte network at a microstructural level. This allows characterisation of osteocyte number density, size, and distribution. Additionally it guides selection of volumes of interest for further imaging with SBF SEM, a high-resolution 3D imaging method, which involves automated sequential slicing and imaging of resin-embedded tissue blocks. We performed SBF SEM at an in-plane pixel size of 10 nm and an out-of-plane spacing between consecutive cuts of 50 nm to image the osteocyte cell processes and canaliculi interconnecting osteocytes and their lacunae in 3D, respectively.
Acknowledgements
The authors would like to acknowledge the Institute for Life Sciences at the University of Southampton for funding and Dr Orestis Katsamenis for assistance with µCT scanning.
Figure - Summary of the correlative µCT & SBF SEM imaging workflow. (A) Bone sample taken from tibiofibular junction (image from Nunez et al., Sci Rep 35:281-99, 2018), (B) reconstructed µCT slice, (C) volume rendering of tibiofibular junction imaged by µCT, (D) sub-volume of (C) showing osteocytes (yellow) and vasculature (red), (E) sub-volume of (D) imaged by SBF SEM, (F) osteocytes (yellow) and their processes (green) segmented from E.
Links to external websites
The University cannot accept responsibility for external websites.