In this post, we’re going to discuss the ways in which we manage the University’s data, and how we’re using it to monitor the performance of the OneWeb programme.
The original business case for OneWeb hypothesised benefits such as:
- improved domain authority
- link performance to user needs
- operational cost savings for the University.
As a team, we’ve been asking ourselves how we can show the success of the programme to our community, and also leave a legacy behind.
Performance and data are not just for geeks
We take data and performance seriously. The University generates large volumes of data, mainly unstructured, and our public website produces millions of interactions with different user groups across a wide range of topics, products and services. Used correctly, this data can give us unique insights into the challenges and opportunities our end-users face, and help us to iterate and improve our services.
Working for a large and complex organisation brings some challenges in relation to data management and how you track performance, so we’re here to discuss what we’re doing about it as part of OneWeb.
Starting with OKRs…
What are OKRs and why are they important?
Big and small tech companies often use Objectives and Key Results (OKRs) to set goals. Think of these as ways of documenting what is going to be delivered and what the value of those deliverables will be. Using this framework, the OneWeb Programme goals would be set out as follows:
Programme Level Objectives (what we are trying to deliver), for example:
- Transform our web presence by creating a single domain that is fundamentally user-centric
- Establish consistent processes for managing the content on that domain
Key Results (how we will know if we’ve succeeded because success is defined by whether or not the result has value!) might be:
- Increase in enrolled students
- Improved performance of our website
- Migrate to the new technology platforms and away from the thousands of websites that comprise our current digital estate
These programme-level OKRs then cascade down into each project’s OKRs and become more granular.
Project Level Objectives:
- Produce actionable intelligence mapped against user needs
- Performance Monitoring becomes part of the delivery process of OneWeb projects, with clear success criteria accompanying every product launch
- Create a performance analytics strategy
- Tie each user need to a business goal – create a content workflow that ensures that each new piece of content ties directly to a user need that supports a business goal
Key Results (aka Benefits, Outcomes)
- The OneWeb team, and stakeholders, have a method of monitoring and managing the content services that are produced in the OneWeb programme
- Allows us to show results on the work we’ve done and the impact it has had
- Allows us to show that the programme has had a positive return on investment (ROI) for the business
- The insight and analysis guides critical business decisions that underpin product development and strategic decisions on the OneWeb programme
Tackling our challenges
Performance monitoring is not new to the University’s Digital Team. However, it’s fair to say that, due to the complexity in which we operate, it hasn’t been as effective as it needs to be. . Part of the legacy the OneWeb programme intends to leave behind is a new and improved standard for performance monitoring.
Consistently measured bounce rates and page performance across our new products will certaintly be welcome insights for our Product Managers. But our challenge is to report on how we’re meeting our users’ needs. For example, how do we know if we’ve met a user need such as “Do I want to stay in halls?”? The temptation is to immediately drill down into detail, but we are going to approach this from the top down.
Proposed solutions
We’ve proposed a reporting hierarchy that would provide users with high level view and allow deeper analysis than before.
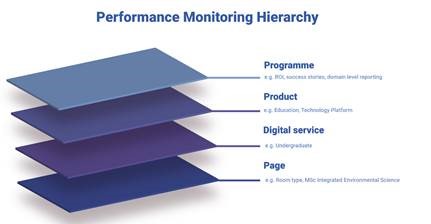
Image: the multiple layers of performance monitoring
At the top, we will report on indicators such as ROI and domain level reporting. This would allow colleagues to drill down into products, such as our education product offering and the digital services that make up our students’ end-to-end journey.
The Undergraduate Journey was mapped in a previous phase of the Programme and identified key user needs at each stage. The various data points, metrics and stats were then mapped to the journey to reveal a conversion funnel. In this way, we hope to provide quantitative analysis that reveals if we are meeting our users’ needs and highlights opportunities for us to deliver a better user experience..
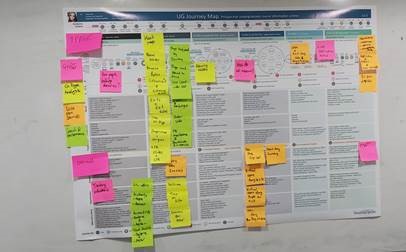
Image: snapshot of the UG reporting ideation session
It will take time to build a picture due to the business and users cycles we work with, and we will refine and iterate our approach to performance reporting accordingly.
Of course there’s no substitute for granular, on-page, analytics for product managers who want to know more about how users are interacting with their products (e.g. course pages). The more commonplace dashboards showing bounce rate and average time on page will still be provided at a course level as we’ve done previously. But, where possible, we want to provide information on subject, school and faculty level so that trends can be observed and used to set an internal benchmark.
Another challenge we face, as do lots of other large and complex organisations, is inconsistent data. It’s not always straight-forward to track every interaction, so we’re exploring how we can bridge it where possible.
For now, we use tools such as spreadsheets and dashboards. The emphasis is on providing performance monitoring and insight analytics to the product managers as soon as possible. This means we expect to see some analysis following the Beta launch in phase 3.
We’re not doing it to you, we’re doing it with you
Our mantra as a team has always been to collaborate with the rest of the University. We want to empower our stakeholders to put their trust in the performance data, and for our team to have the confidence to make decisions to improve our products. Other off-the-shelf analytics tools can be explored later when the results are shared with a wider audience, with a strong emphasis on transparency. Several organisations have even gone as far as to share their insight analytics with their stakeholders.
Thanks for reading
We’re keeping a close eye on the UK government and Australian government sites to see how their product iterates in the open. I hope we got you excited.
We’ll be sharing our progress regularly here. But if you want to know more, please sign up to our Show & Tell and this blog, or just drop us an email to keep in touch.