Visualising our website
Thanks to Jo Caley (aka SEO Jo) and Rayne Prendergast, our Search Engine Optimisation (SEO) specialists, for putting this blog post together.
We’ve been using a tool called ‘crawl visualisations’ to reveal some significant issues with the structure of our website.
Once a user is on our website, it’s very easy for them to get lost or to arrive at content dead-ends. This leads to a poor user experience, meaning they’re less likely to return to our website in future.
Search engines (e.g. Google, Bing etc) must crawl a LOT of URLs to understand the site. Issues such as duplicate content and sitemap errors can confuse search engines and ultimately waste our crawl budget, meaning they will not index or rank our pages, which in turn leads to users not finding our pages in their search results. Boo!
We’re going to deal with this as part of our OneWeb search engine optimisation (SEO) and larger strategy work. We’ve already made a start by sharing these visualisations and information about the work as part of our challenge session – but the data and findings were so compelling we want to share them with you too.
Focus on your users
You’ve probably heard us banging the ‘user needs first’ drum over the past year. Our website is not for us, it’s for the people we seek to serve as a University. So that means focusing and understanding their needs first.
In other words, more about them, less about us.
As part of the preparation for the challenge session, we carried out a crawl (Search engines crawl websites to discover content and store it in databases) of the main domain https://www.southampton.ac.uk, using Screaming Frog. We then used the output from the crawl to create force-directed graphs; interactive visualisations of our website’s architectures.

An example of an interactive force-directed crawl diagram from Screaming Frog. Credit: Screaming Frog
 An example of an interactive force-directed crawl diagram from Screaming Frog. Right click on a node to focus here. Credit: Screaming Frog
Mapping the data
The crawler encountered 323,000 urls in total. Screaming Frog shorten each crawl map to the first 10,000 urls it finds, but even then the file is too large to reproduce online. Here are two screenshots instead, one showing a force-directed crawl diagram, the other a force-directed directory tree diagram.
Crawl visualisation
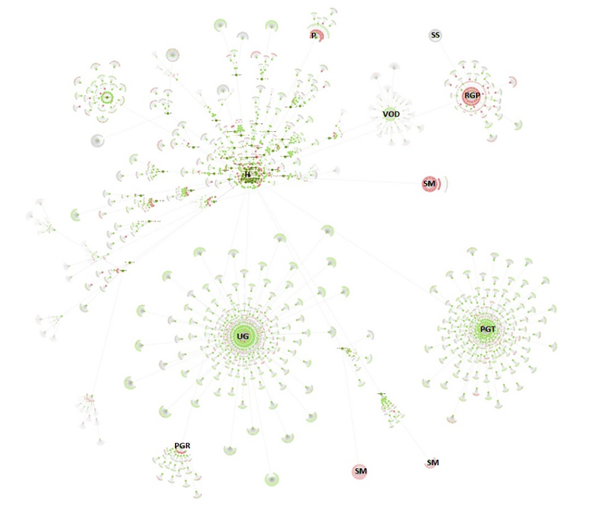
The internal linking structure of https://www.southampton.ac.uk (first 10,000 urls encountered), created using a force-directed crawl diagram from Screaming Frog. KEY: H: Home page, VOD: Virtual open day, P: Prospectuses, SS: Student services, RGP: Regulations, guides and policies, SM: Sitemap, PGT: Postgraduate taught course pages, PGR: Postgraduate research pages, UG: Undergraduate pages
Directory tree visualisation
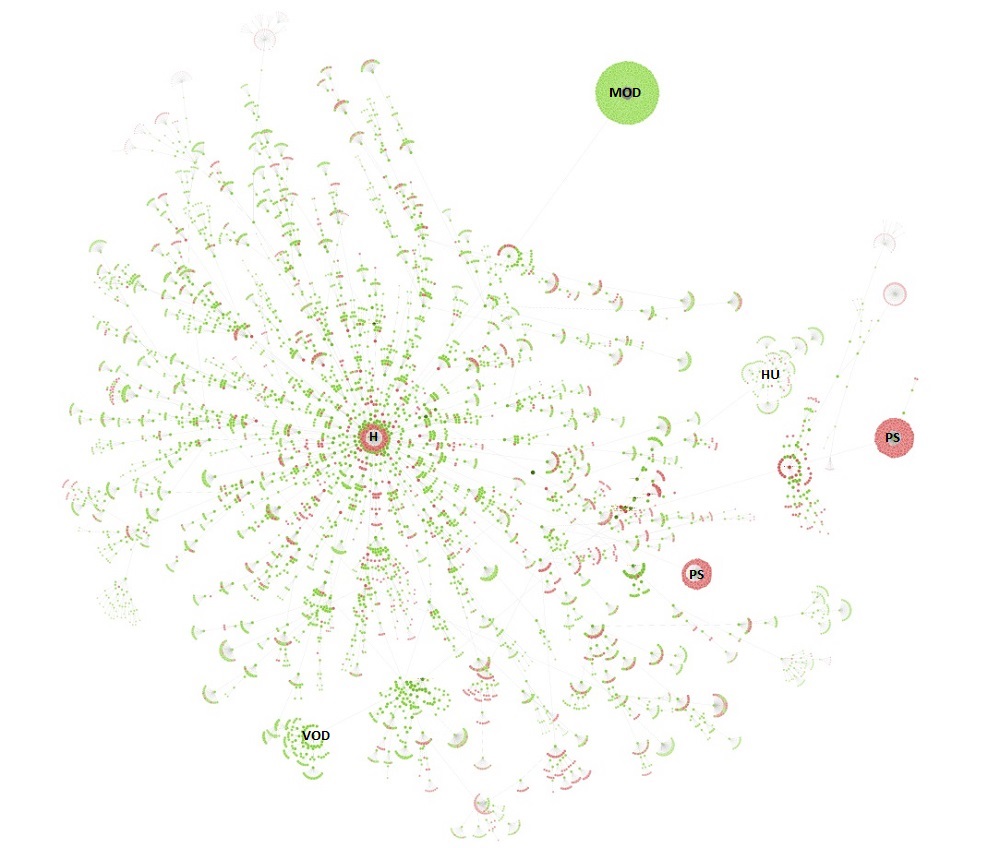
The directory tree visualisation of https://www.southampton.ac.uk (first 10,000 urls encountered), created using a force-directed directory tree diagram from Screaming Frog. KEY: H: Home page, MOD: Modules, PS: Programme Specs, HU: Humanities, VOD: Virtual Open Day
How to read a crawl visualisation
Both visualisations’ start URL was the home page and show the increasing crawl depth of the site. Crawl depth is the minimum number of clicks it takes to get from the home page to the destination URL.
The green nodes are pages which are indexable, meaning that search engines (e.g. Google, Bing etc). can find the page and return it in search results.
The red nodes are pages which are non-indexable by search engines. They may be non-indexable because the pages:
- are paginated
- contain a “nofollow” or “canonical” tag (for example, to prevent duplicate content)
- redirect, return an error (http status code)
- are blocked in the robots.txt.
Therefore, they can identify areas of concern.
The grey nodes show where a page has child pages, but the visualisation doesn’t show them as it has reached the 10,000 url limit.
The lines represent the link between one URL and another, via the shortest path.
Why visualisations are useful
Crawl visualisations show the internal linking structure of a website. Internal links help to establish hierarchy within a website and pass value and authority around the site. Effectively, this is how search engines might crawl a site and rank the content within.
Directory tree visualisations are useful because they show the organisation of a website and how users might navigate a site.
Either way, they provide scale and perspective and can reveal underlying issues that are otherwise difficult to detect.
What it all means
Our website is massive. These diagrams represent just 3.1% of the southampton.ac.uk domain. The crawl diagram shows that our website is very segmented, with undergraduate and postgraduate course pages operating as distinct and separate websites in themselves.
Duplicate content and orphan pages (i.e. pages that aren’t linked to any other page) are likely to be issues and the sitemap template seems to be throwing errors. Other potential problem areas include the regulations, guides and policies, prospectuses, and student services sections.
The directory tree diagram shows how deep our website is (10+ levels) and that the ‘modules’ section is orphaned – representing a missed opportunity to acquire and engage prospective students through organic search (Google, for instance, tends not to index or rank orphan pages). There are also possible issues here with programme-specification pages – and more worryingly – some level 2 pages around the home page. This is a key area which OneWeb will need to address.
Next steps
Creating these diagrams has enabled us to visualise the website, albeit on a reduced scale, and produce a list of valuable action points to take forward into OneWeb.
As part of the preparation for OneWeb, it is vital we drive a focused SEO strategy around keywords and metadata, and test the information architecture of the website with our users.
This will also feed into the strategy work around taxonomies (the way a website organises its data into categories and subcategories), metatagging (keywords and phrases which tell search engines what content to include in search results for users), and continuing iterations of workflows and governance.
As always, if you have any questions, please get in touch. Thank you.